| 2025-12-28 09:20:00+08:00 |
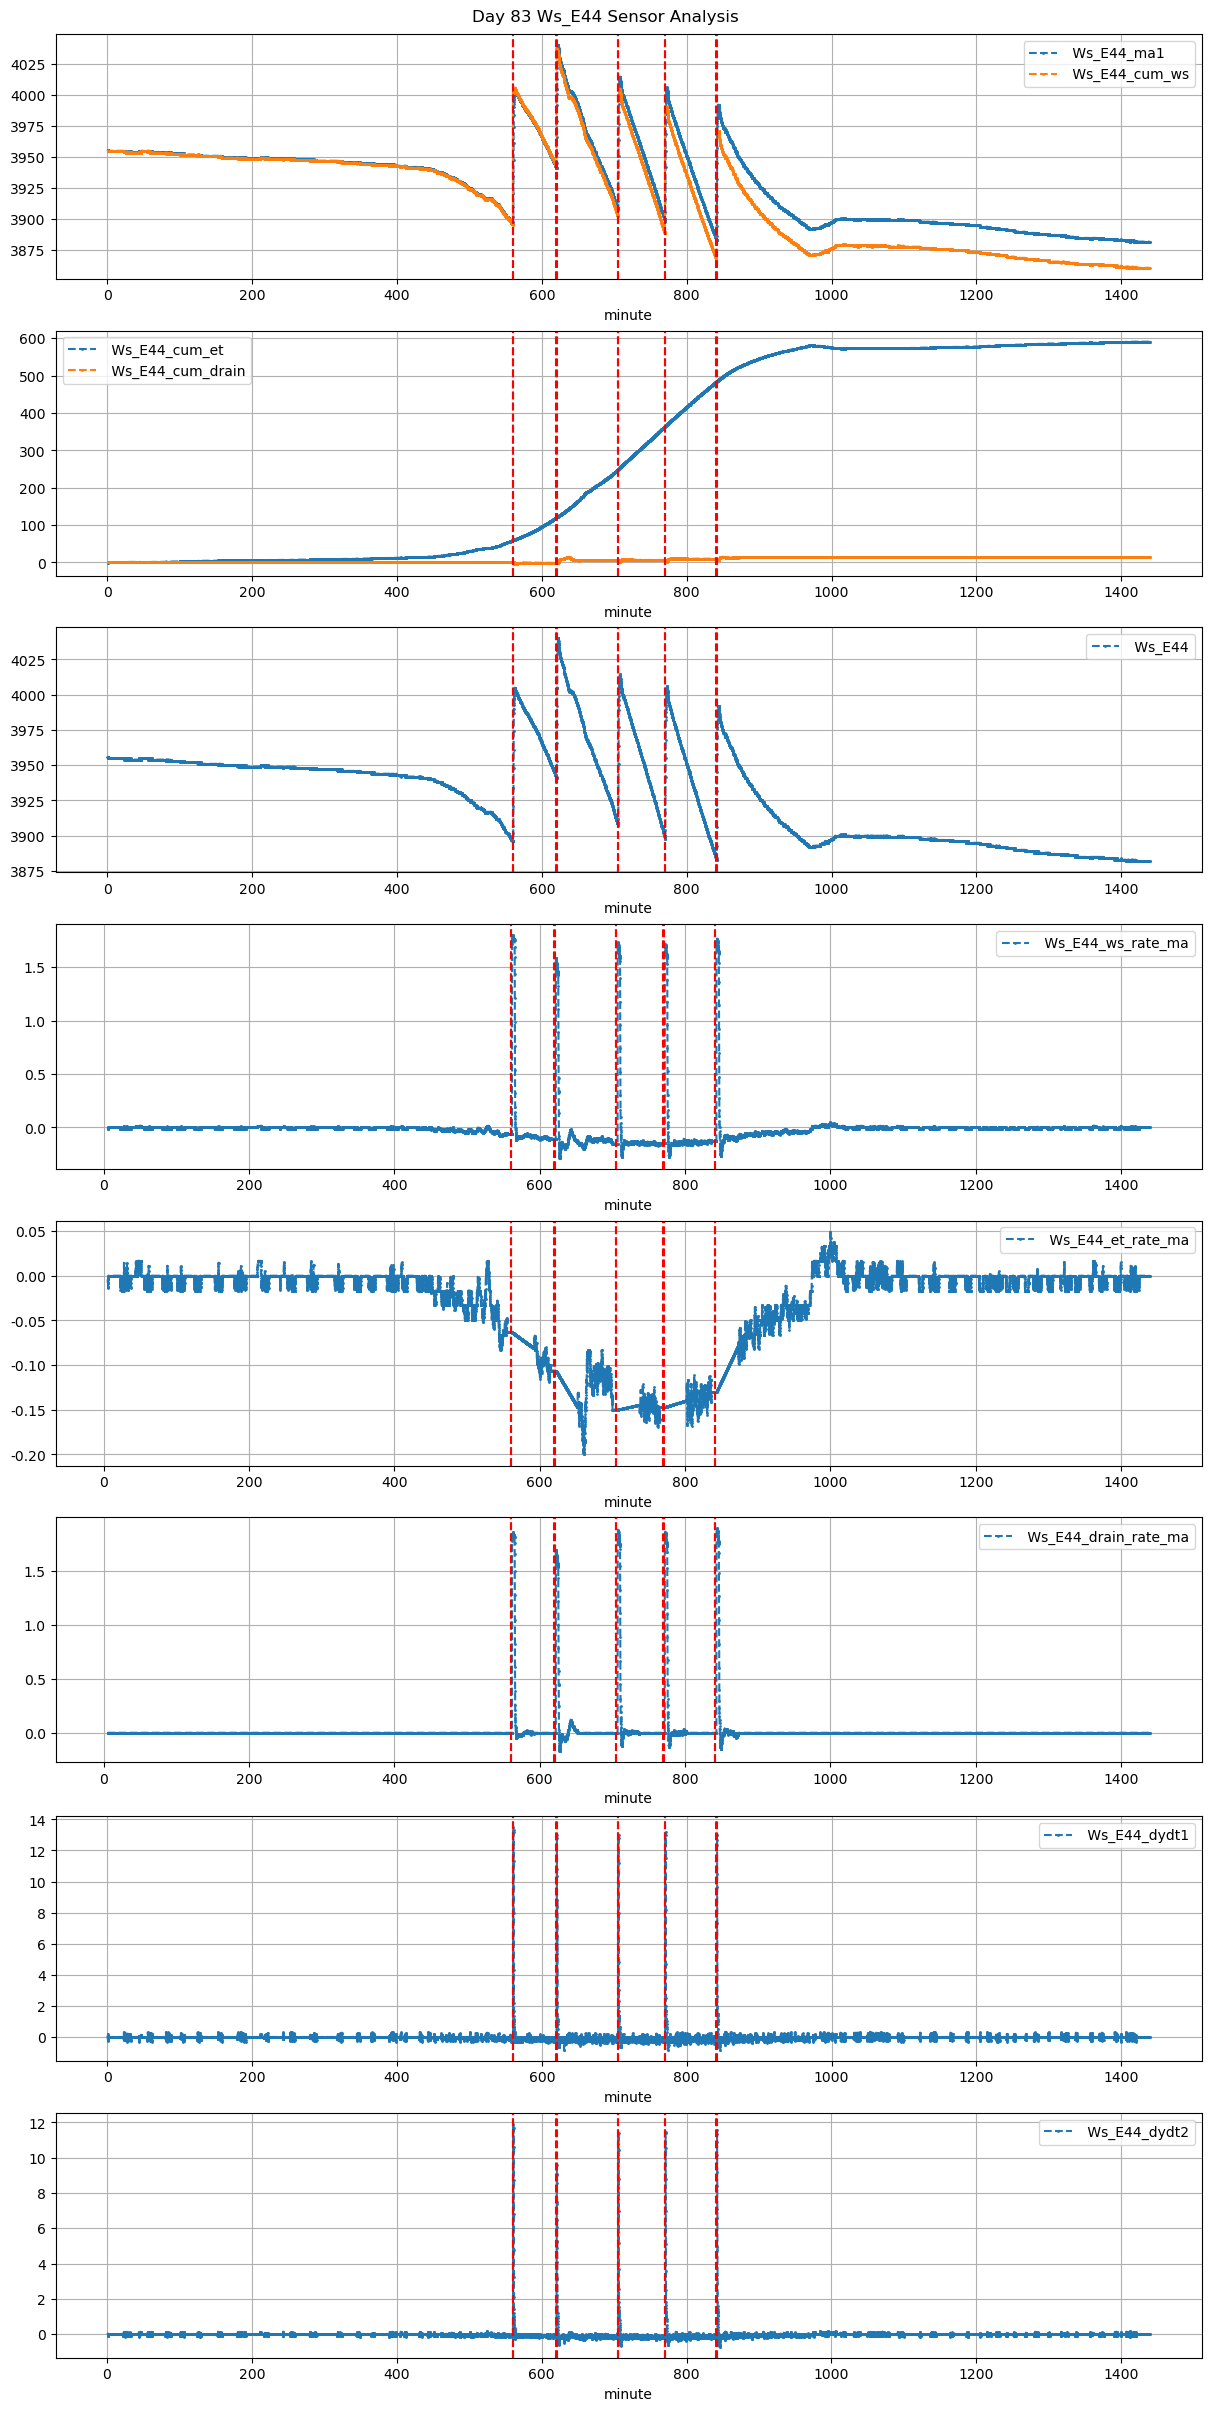
83 |
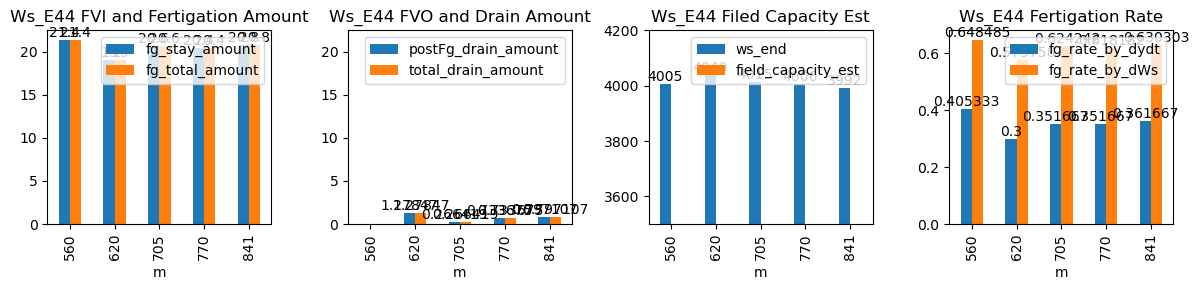
560 |
Ws_E44 |
0.360541 |
30 |
560.00 |
560.416667 |
560.55 |
561.833333 |
NaN |
NaN |
NaN |
3898.0 |
4005.0 |
33 |
-0.063277 |
-0.093889 |
-0.081190 |
0.405333 |
0.648485 |
21.4 |
25.0 |
77.0 |
21.4 |
0.0 |
-0.074532 |
NaN |
-0.074532 |
| 2025-12-28 10:20:00+08:00 |
83 |
620 |
Ws_E44 |
0.360541 |
30 |
620.00 |
620.416667 |
620.55 |
622.083333 |
NaN |
NaN |
NaN |
3945.0 |
4040.0 |
33 |
-0.106073 |
-0.191944 |
-0.147425 |
0.300000 |
0.575758 |
19.0 |
25.0 |
92.0 |
19.0 |
0.0 |
1.278470 |
NaN |
1.278470 |
| 2025-12-28 11:45:00+08:00 |
83 |
705 |
Ws_E44 |
0.360541 |
30 |
705.00 |
705.500000 |
705.55 |
707.166667 |
NaN |
NaN |
NaN |
3912.0 |
4015.0 |
33 |
-0.149882 |
-0.185278 |
-0.144444 |
0.351667 |
0.624242 |
20.6 |
30.0 |
97.0 |
20.6 |
0.0 |
0.266419 |
NaN |
0.266419 |
| 2025-12-28 12:50:00+08:00 |
83 |
770 |
Ws_E44 |
0.360541 |
30 |
770.00 |
770.416667 |
770.55 |
772.083333 |
NaN |
NaN |
NaN |
3904.0 |
4006.0 |
33 |
-0.147140 |
-0.202361 |
-0.139416 |
0.351667 |
0.618182 |
20.4 |
25.0 |
92.0 |
20.4 |
0.0 |
0.733675 |
NaN |
0.733675 |
| 2025-12-28 14:01:05+08:00 |
83 |
841 |
Ws_E44 |
0.360541 |
30 |
841.08 |
841.416667 |
841.63 |
843.166667 |
NaN |
NaN |
NaN |
3888.0 |
3992.0 |
33 |
-0.130139 |
-0.185417 |
-0.078053 |
0.361667 |
0.630303 |
20.8 |
20.2 |
92.2 |
20.8 |
0.0 |
0.797107 |
NaN |
0.797107 |