| 2026-01-06 09:45:00+08:00 |
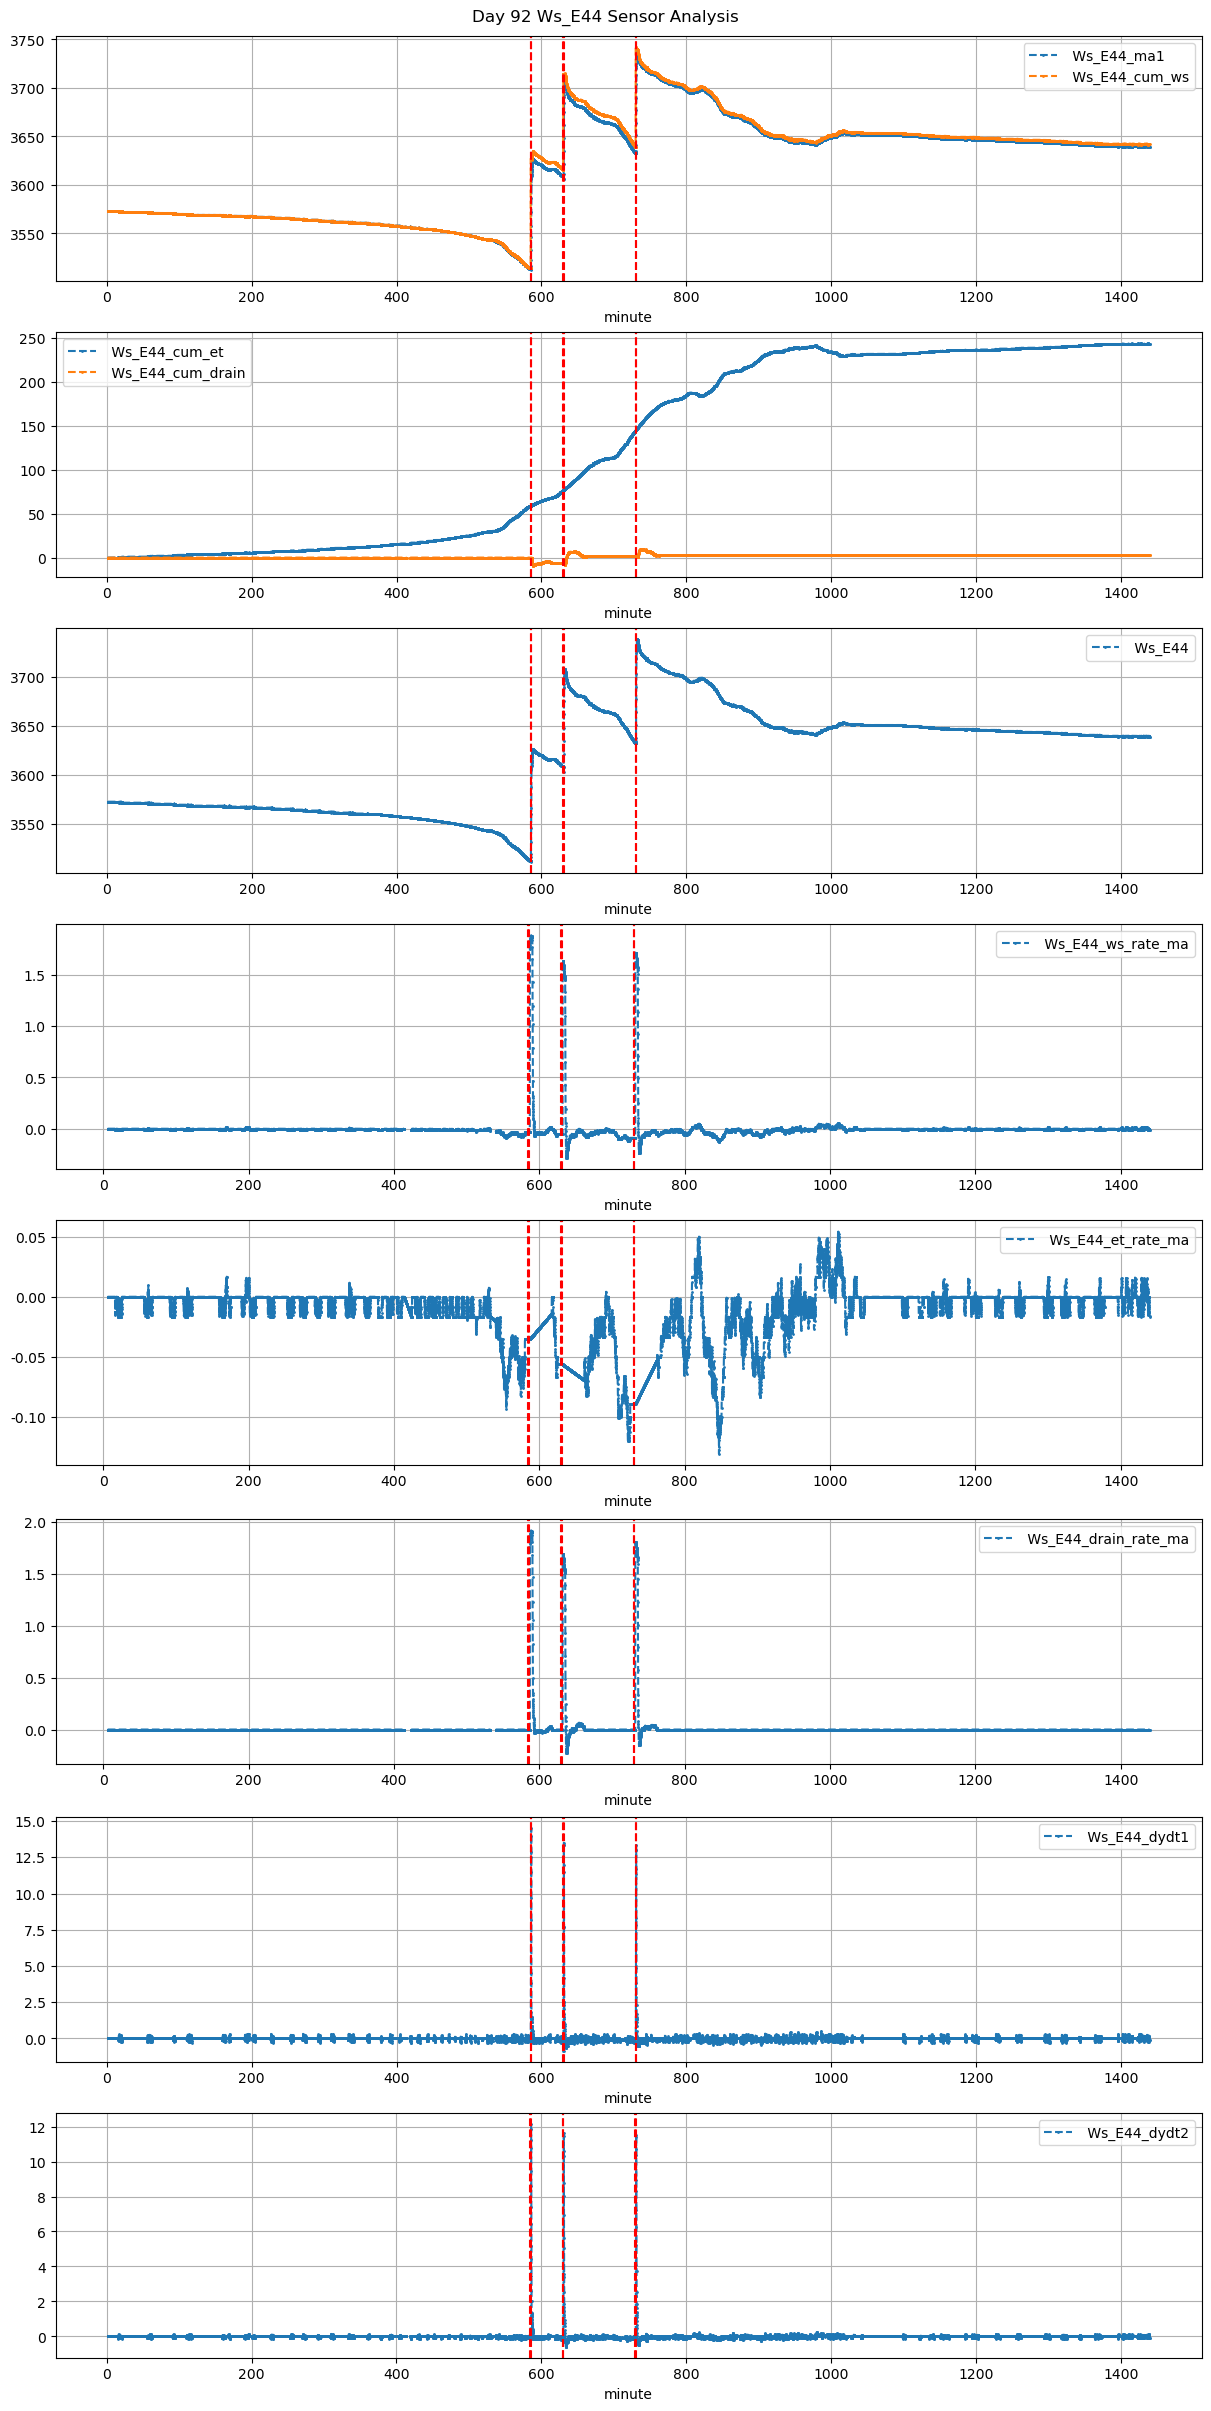
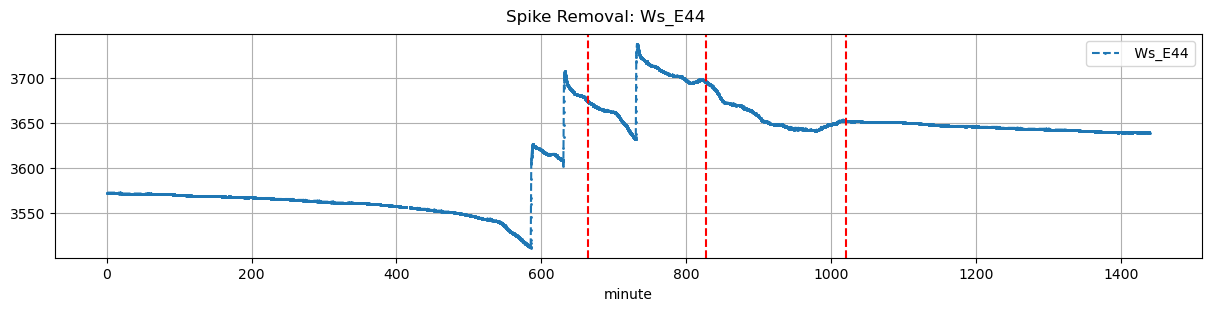
92 |
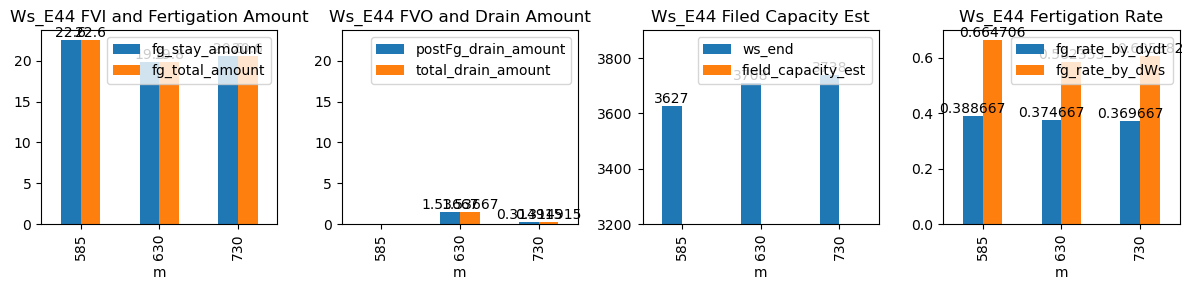
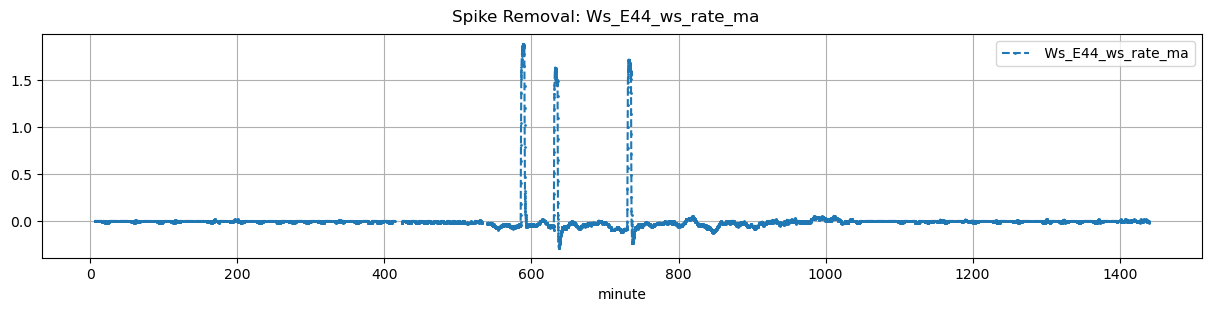
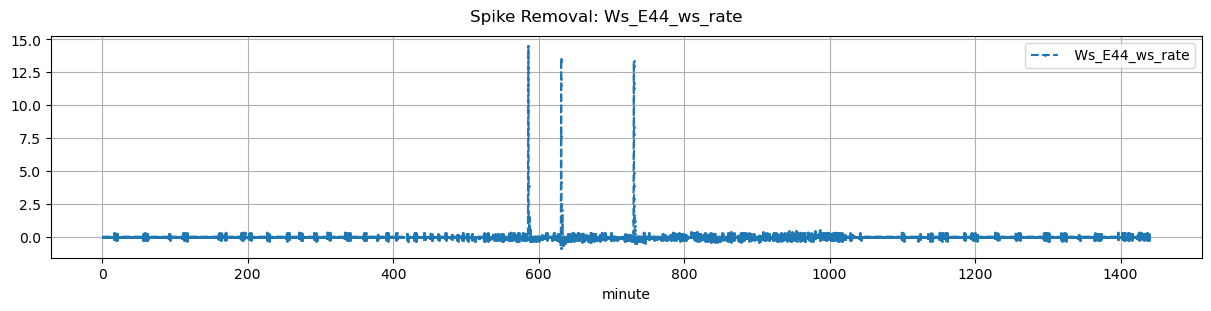
585 |
Ws_E44 |
0.231958 |
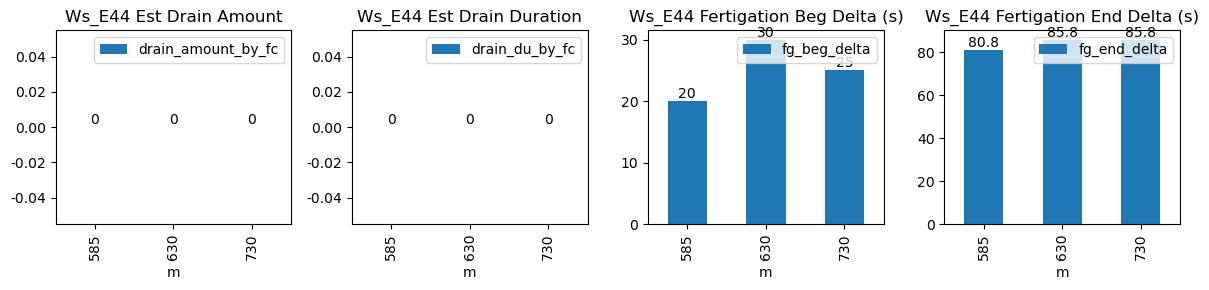
30 |
585.0 |
585.333333 |
585.57 |
586.916667 |
NaN |
NaN |
NaN |
3514.0 |
3627.0 |
34 |
-0.049358 |
-0.035139 |
-0.014051 |
0.388667 |
0.664706 |
22.6 |
20.0 |
80.8 |
22.6 |
0.0 |
-1.227279 |
NaN |
-1.227279 |
| 2026-01-06 10:30:00+08:00 |
92 |
630 |
Ws_E44 |
0.231958 |
30 |
630.0 |
630.500000 |
630.57 |
632.000000 |
NaN |
NaN |
NaN |
3609.0 |
3708.0 |
34 |
-0.056244 |
-0.178750 |
-0.069420 |
0.374667 |
0.582353 |
19.8 |
30.0 |
85.8 |
19.8 |
0.0 |
1.536668 |
NaN |
1.536668 |
| 2026-01-06 12:10:00+08:00 |
92 |
730 |
Ws_E44 |
0.231958 |
30 |
730.0 |
730.416667 |
730.57 |
732.000000 |
NaN |
NaN |
NaN |
3635.0 |
3738.0 |
34 |
-0.089301 |
-0.149583 |
-0.052278 |
0.369667 |
0.605882 |
20.6 |
25.0 |
85.8 |
20.6 |
0.0 |
0.314915 |
NaN |
0.314915 |