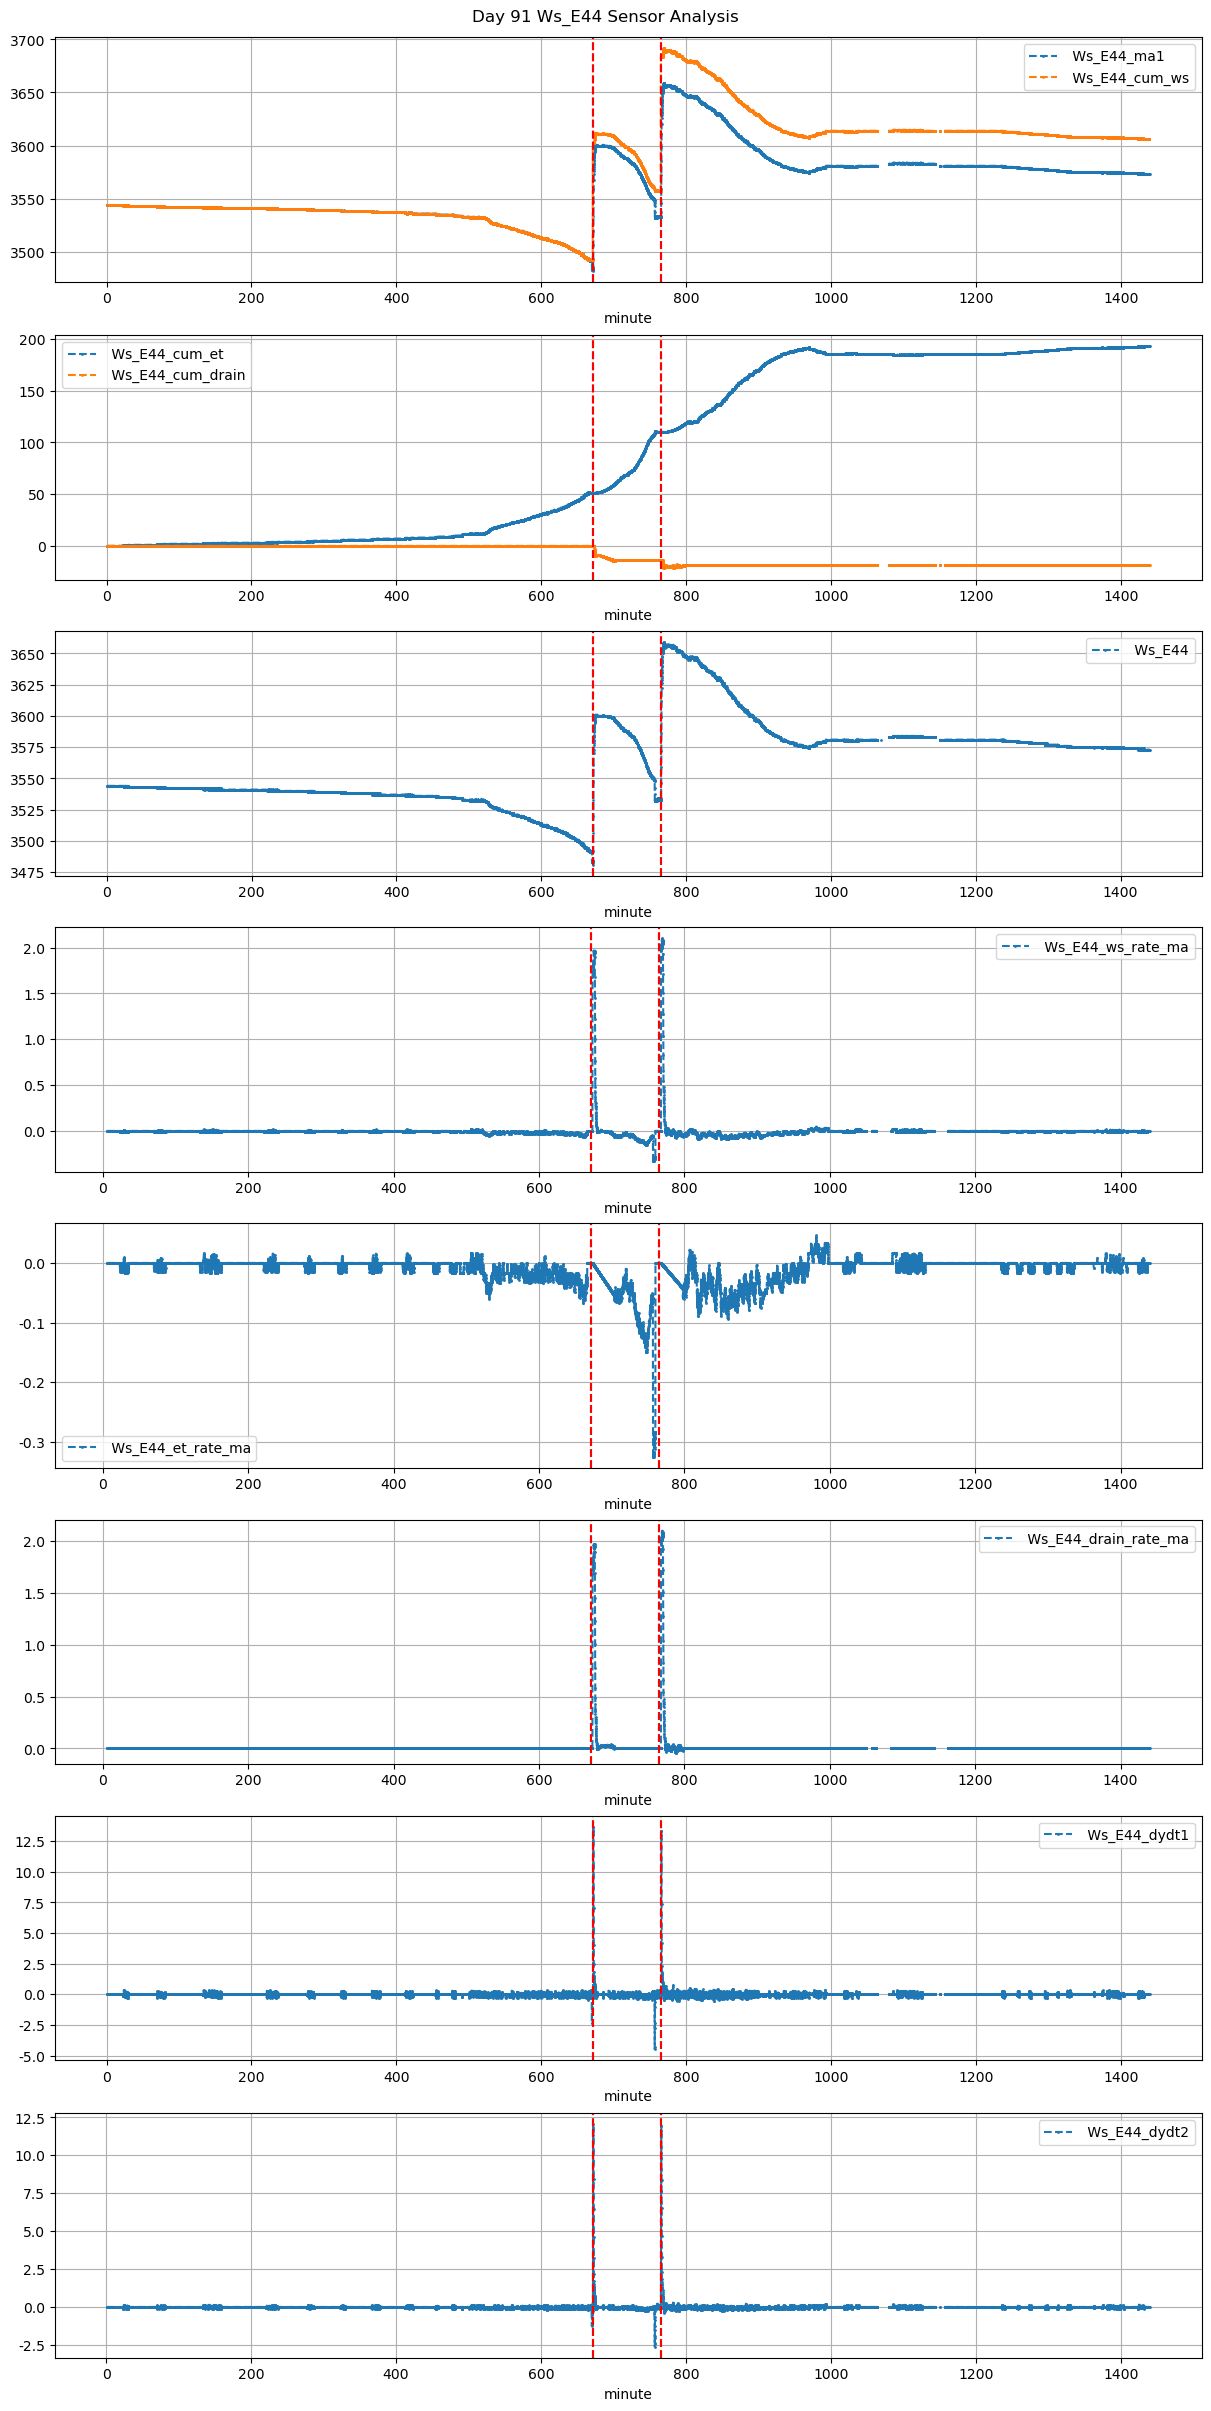
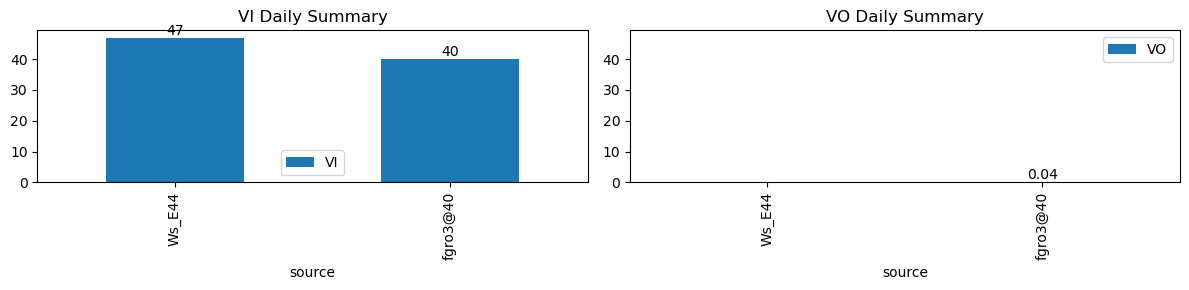
VI and VO Daily Summary
| ws_name | total_dp | nan_dp | nan_filled_dp | long_gap_dp | num_spike |
|---|---|---|---|---|---|
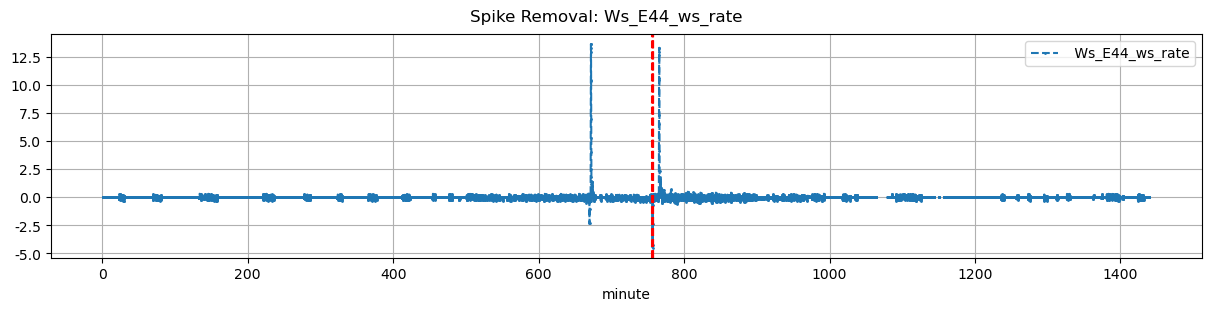
| Ws_E44 | 17269 | 353 | 13855 | 353 | 0 |
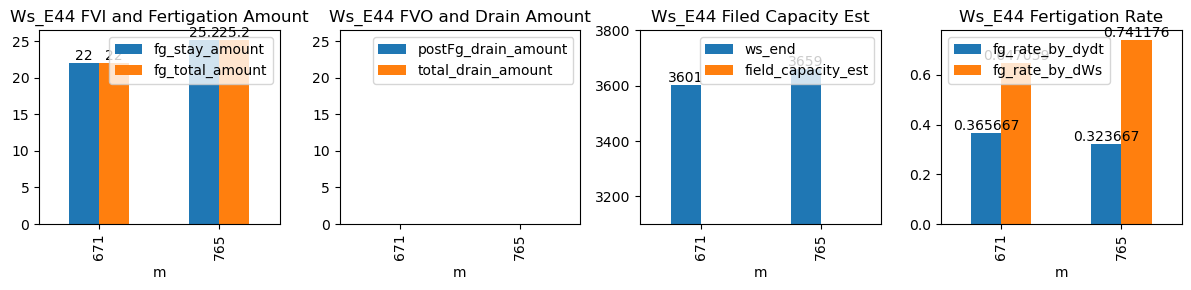
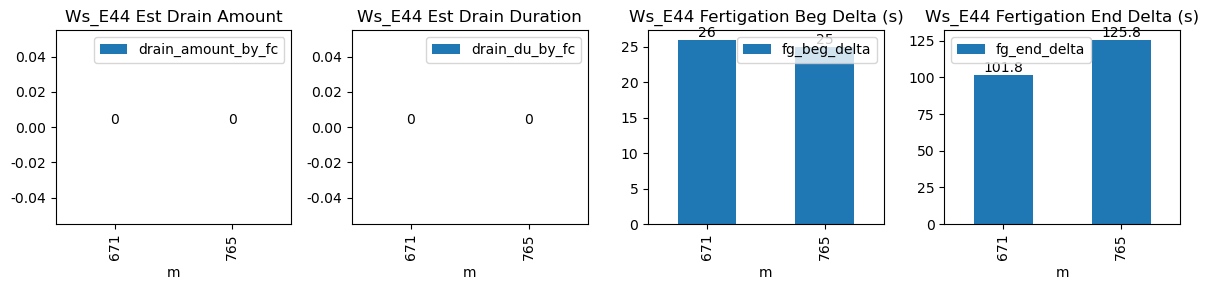
| ds | d | m | ws_name | prominence_cut | max_drain_du | fg_beg | fg_beg_est | fg_end | fg_end_est | drain_amount_by_fc | drain_du_by_fc | drain_rate_by_fc | ws_beg | ws_end | duc | pre_fg_et | post_fg_ws | post_drn_et | fg_rate_by_dydt | fg_rate_by_dWs | fg_stay_amount | fg_beg_delta | fg_end_delta | fg_total_amount | fg_drain_amount | postFg_drain_amount | field_capacity_est | total_drain_amount |
|---|---|---|---|---|---|---|---|---|---|---|---|---|---|---|---|---|---|---|---|---|---|---|---|---|---|---|---|---|
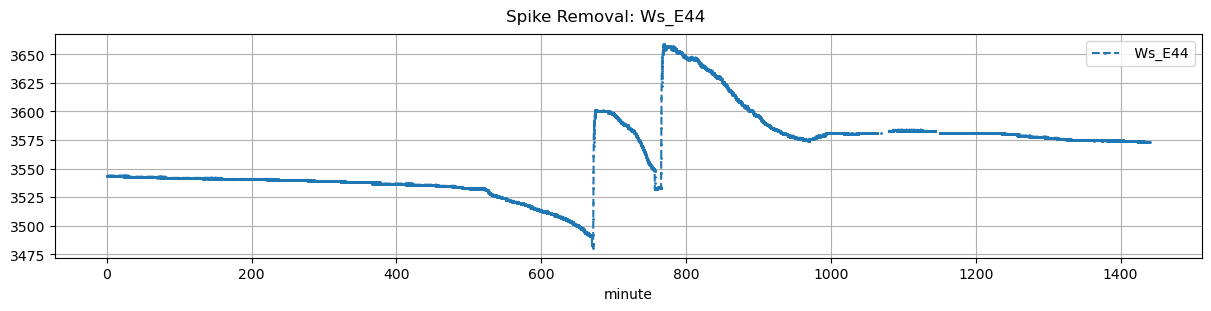
| 2026-01-05 11:11:09+08:00 | 91 | 671 | Ws_E44 | 0.323642 | 30 | 671.15 | 671.583333 | 671.72 | 673.416667 | NaN | NaN | NaN | 3491.0 | 3601.0 | 34 | -0.066481 | 0.0 | -0.054381 | 0.365667 | 0.647059 | 22.0 | 26.0 | 101.8 | 22.0 | 0.0 | -2.856786 | NaN | -2.856786 |
| 2026-01-05 12:45:00+08:00 | 91 | 765 | Ws_E44 | 0.323642 | 30 | 765.00 | 765.416667 | 765.57 | 767.666667 | NaN | NaN | NaN | 3533.0 | 3659.0 | 34 | -0.078555 | 0.0 | -0.042731 | 0.323667 | 0.741176 | 25.2 | 25.0 | 125.8 | 25.2 | 0.0 | -1.077361 | NaN | -1.077361 |