| 2026-01-21 09:10:00+08:00 |
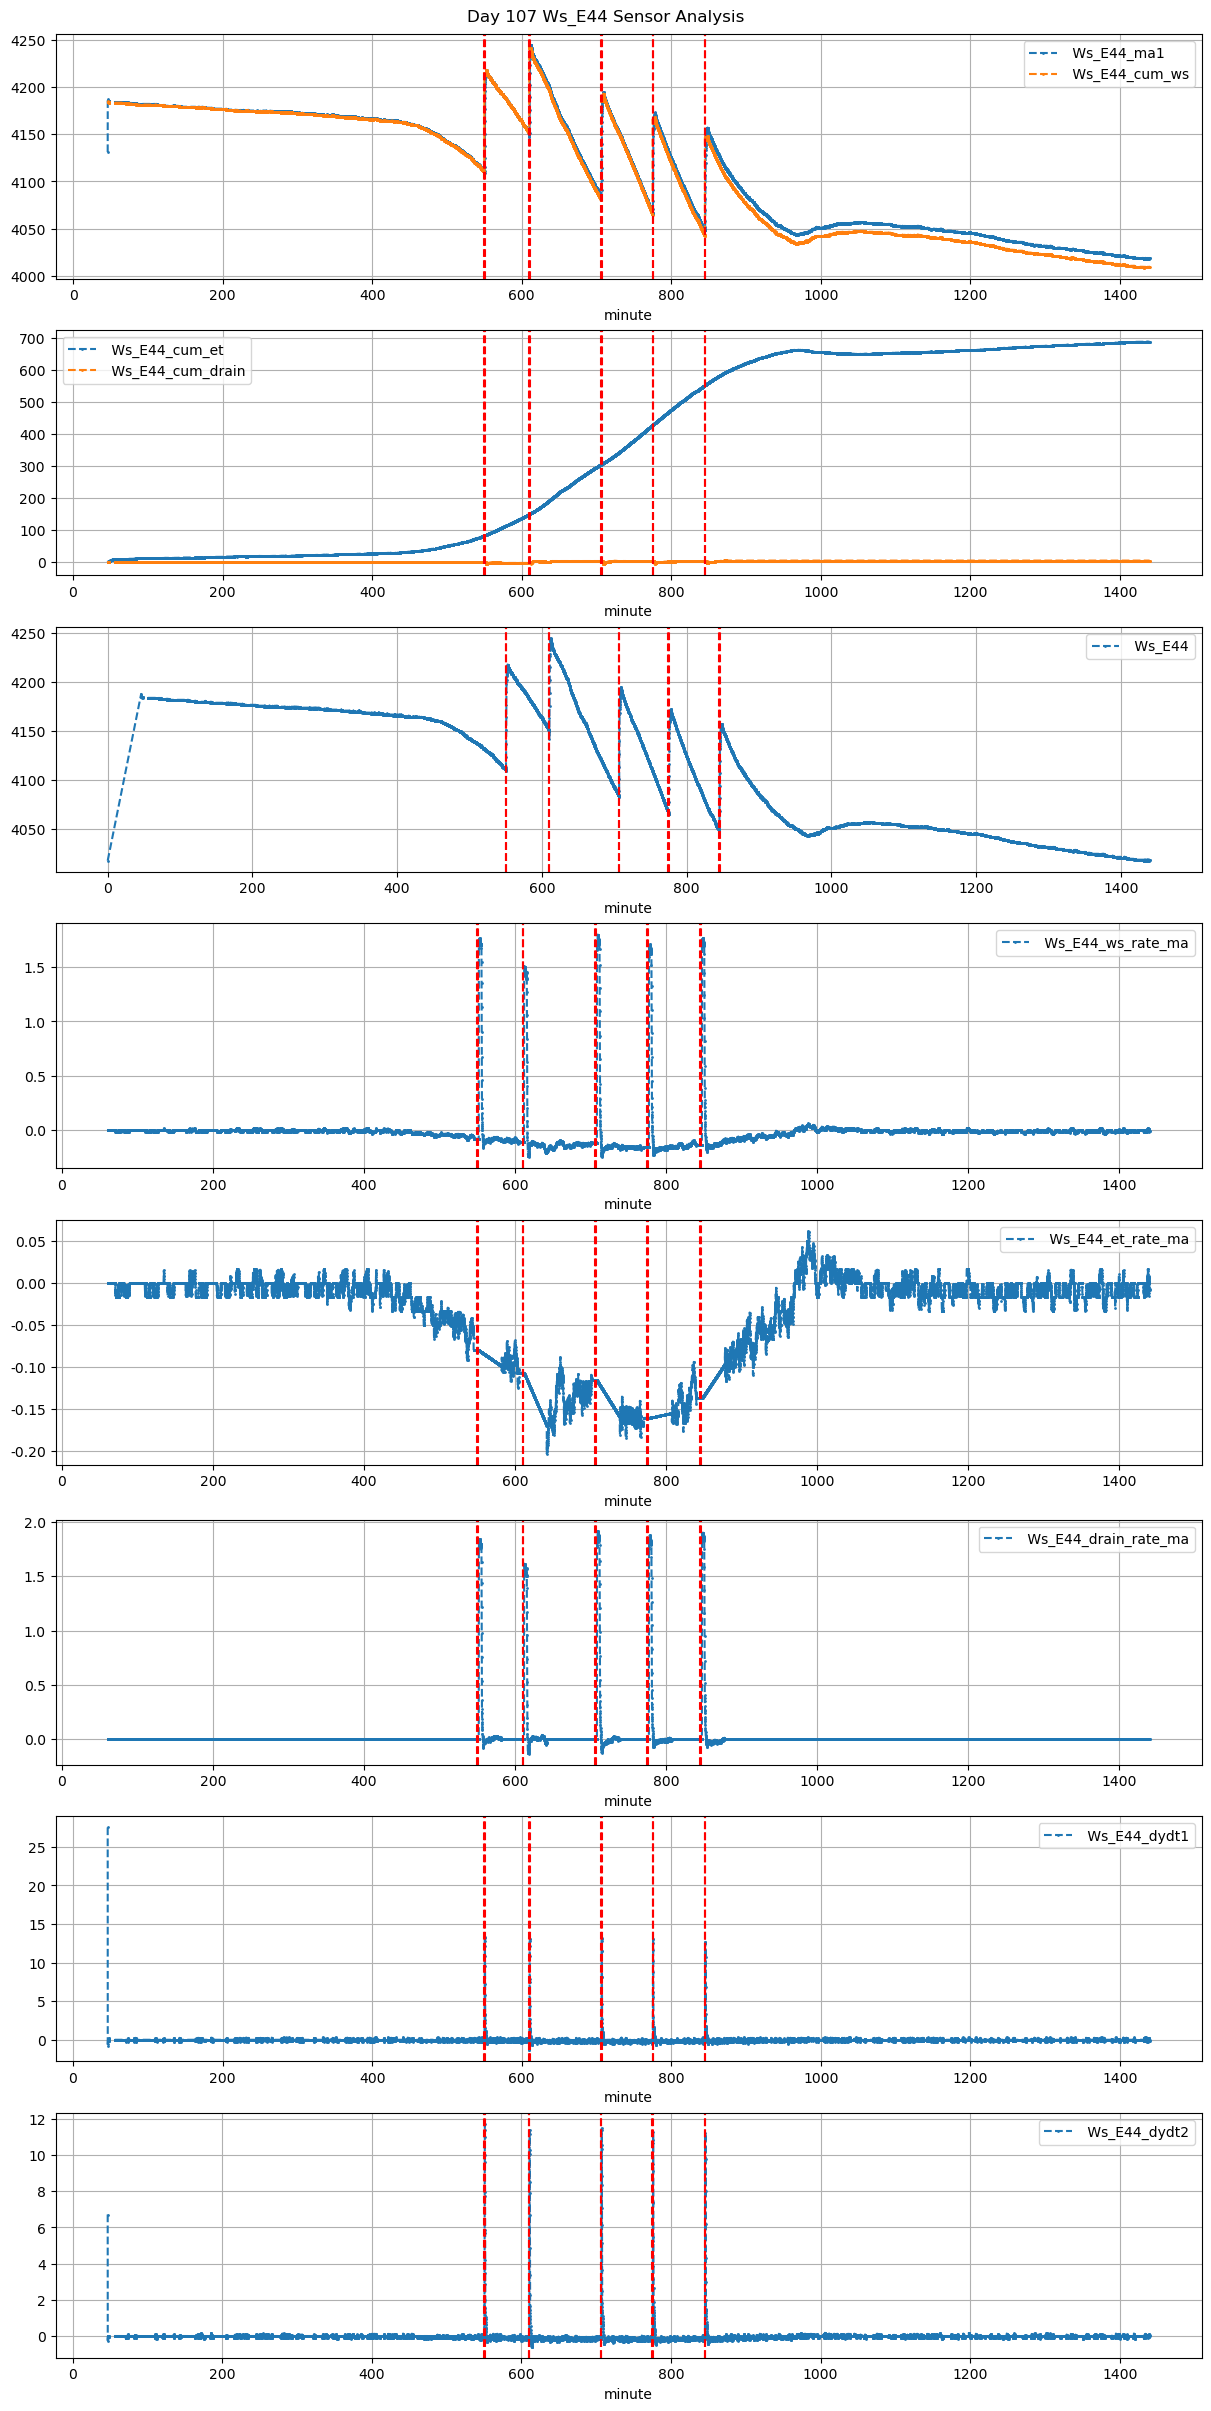
107 |
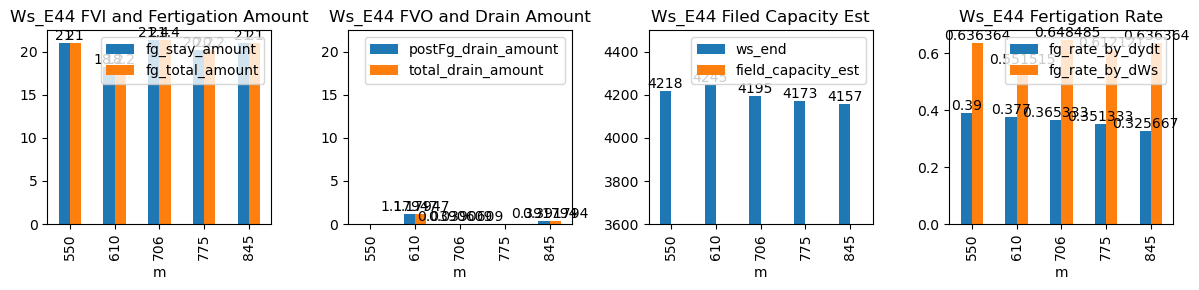
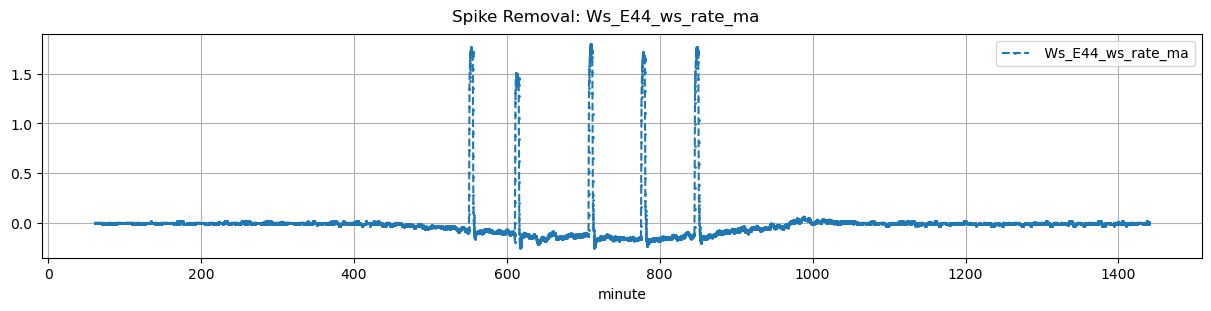
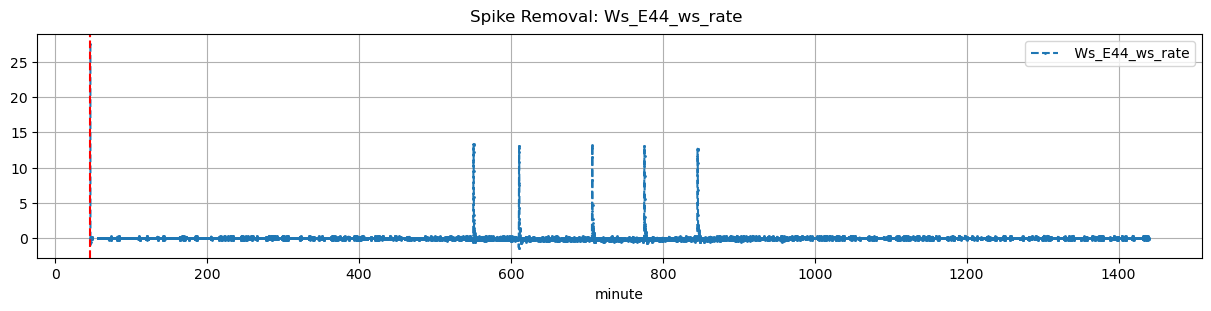
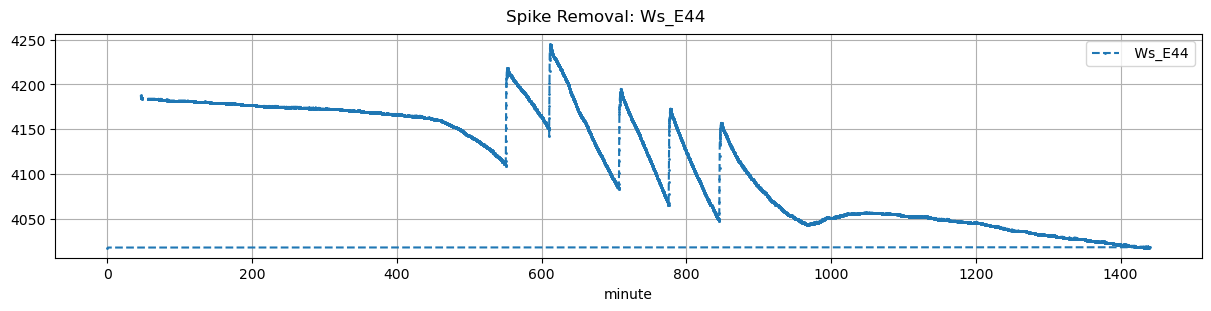
550 |
Ws_E44 |
0.366079 |
30 |
550.00 |
550.416667 |
550.55 |
551.916667 |
NaN |
NaN |
NaN |
4113.0 |
4218.0 |
33 |
-0.079908 |
-0.106806 |
-0.098609 |
0.390000 |
0.636364 |
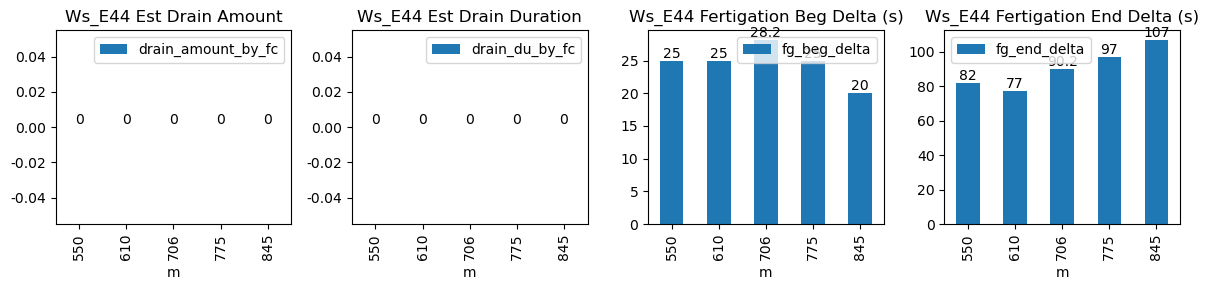
21.0 |
25.0 |
82.0 |
21.0 |
0.0 |
-0.698690 |
NaN |
-0.698690 |
| 2026-01-21 10:10:00+08:00 |
107 |
610 |
Ws_E44 |
0.366079 |
30 |
610.00 |
610.416667 |
610.55 |
611.833333 |
NaN |
NaN |
NaN |
4154.0 |
4245.0 |
33 |
-0.106644 |
-0.165417 |
-0.169542 |
0.377000 |
0.551515 |
18.2 |
25.0 |
77.0 |
18.2 |
0.0 |
1.179474 |
NaN |
1.179474 |
| 2026-01-21 11:46:17+08:00 |
107 |
706 |
Ws_E44 |
0.366079 |
30 |
706.28 |
706.750000 |
706.83 |
708.333333 |
NaN |
NaN |
NaN |
4088.0 |
4195.0 |
33 |
-0.115694 |
-0.181528 |
-0.158889 |
0.365333 |
0.648485 |
21.4 |
28.2 |
90.2 |
21.4 |
0.0 |
0.039061 |
NaN |
0.039061 |
| 2026-01-21 12:55:00+08:00 |
107 |
775 |
Ws_E44 |
0.366079 |
30 |
775.00 |
775.416667 |
775.55 |
777.166667 |
NaN |
NaN |
NaN |
4072.0 |
4173.0 |
33 |
-0.160351 |
-0.186111 |
-0.154671 |
0.351333 |
0.612121 |
20.2 |
25.0 |
97.0 |
20.2 |
0.0 |
-0.169948 |
NaN |
-0.169948 |
| 2026-01-21 14:05:00+08:00 |
107 |
845 |
Ws_E44 |
0.366079 |
30 |
845.00 |
845.333333 |
845.55 |
847.333333 |
NaN |
NaN |
NaN |
4052.0 |
4157.0 |
33 |
-0.137218 |
-0.152639 |
-0.096728 |
0.325667 |
0.636364 |
21.0 |
20.0 |
107.0 |
21.0 |
0.0 |
0.391794 |
NaN |
0.391794 |