| 2026-01-22 09:00:00+08:00 |
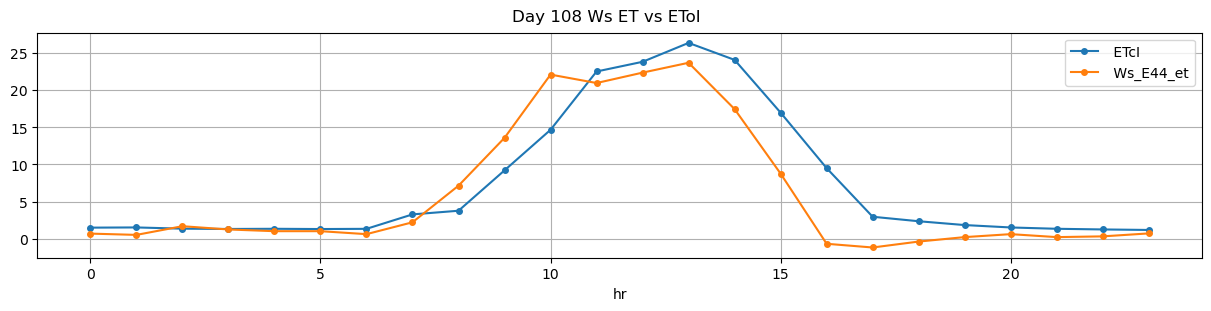
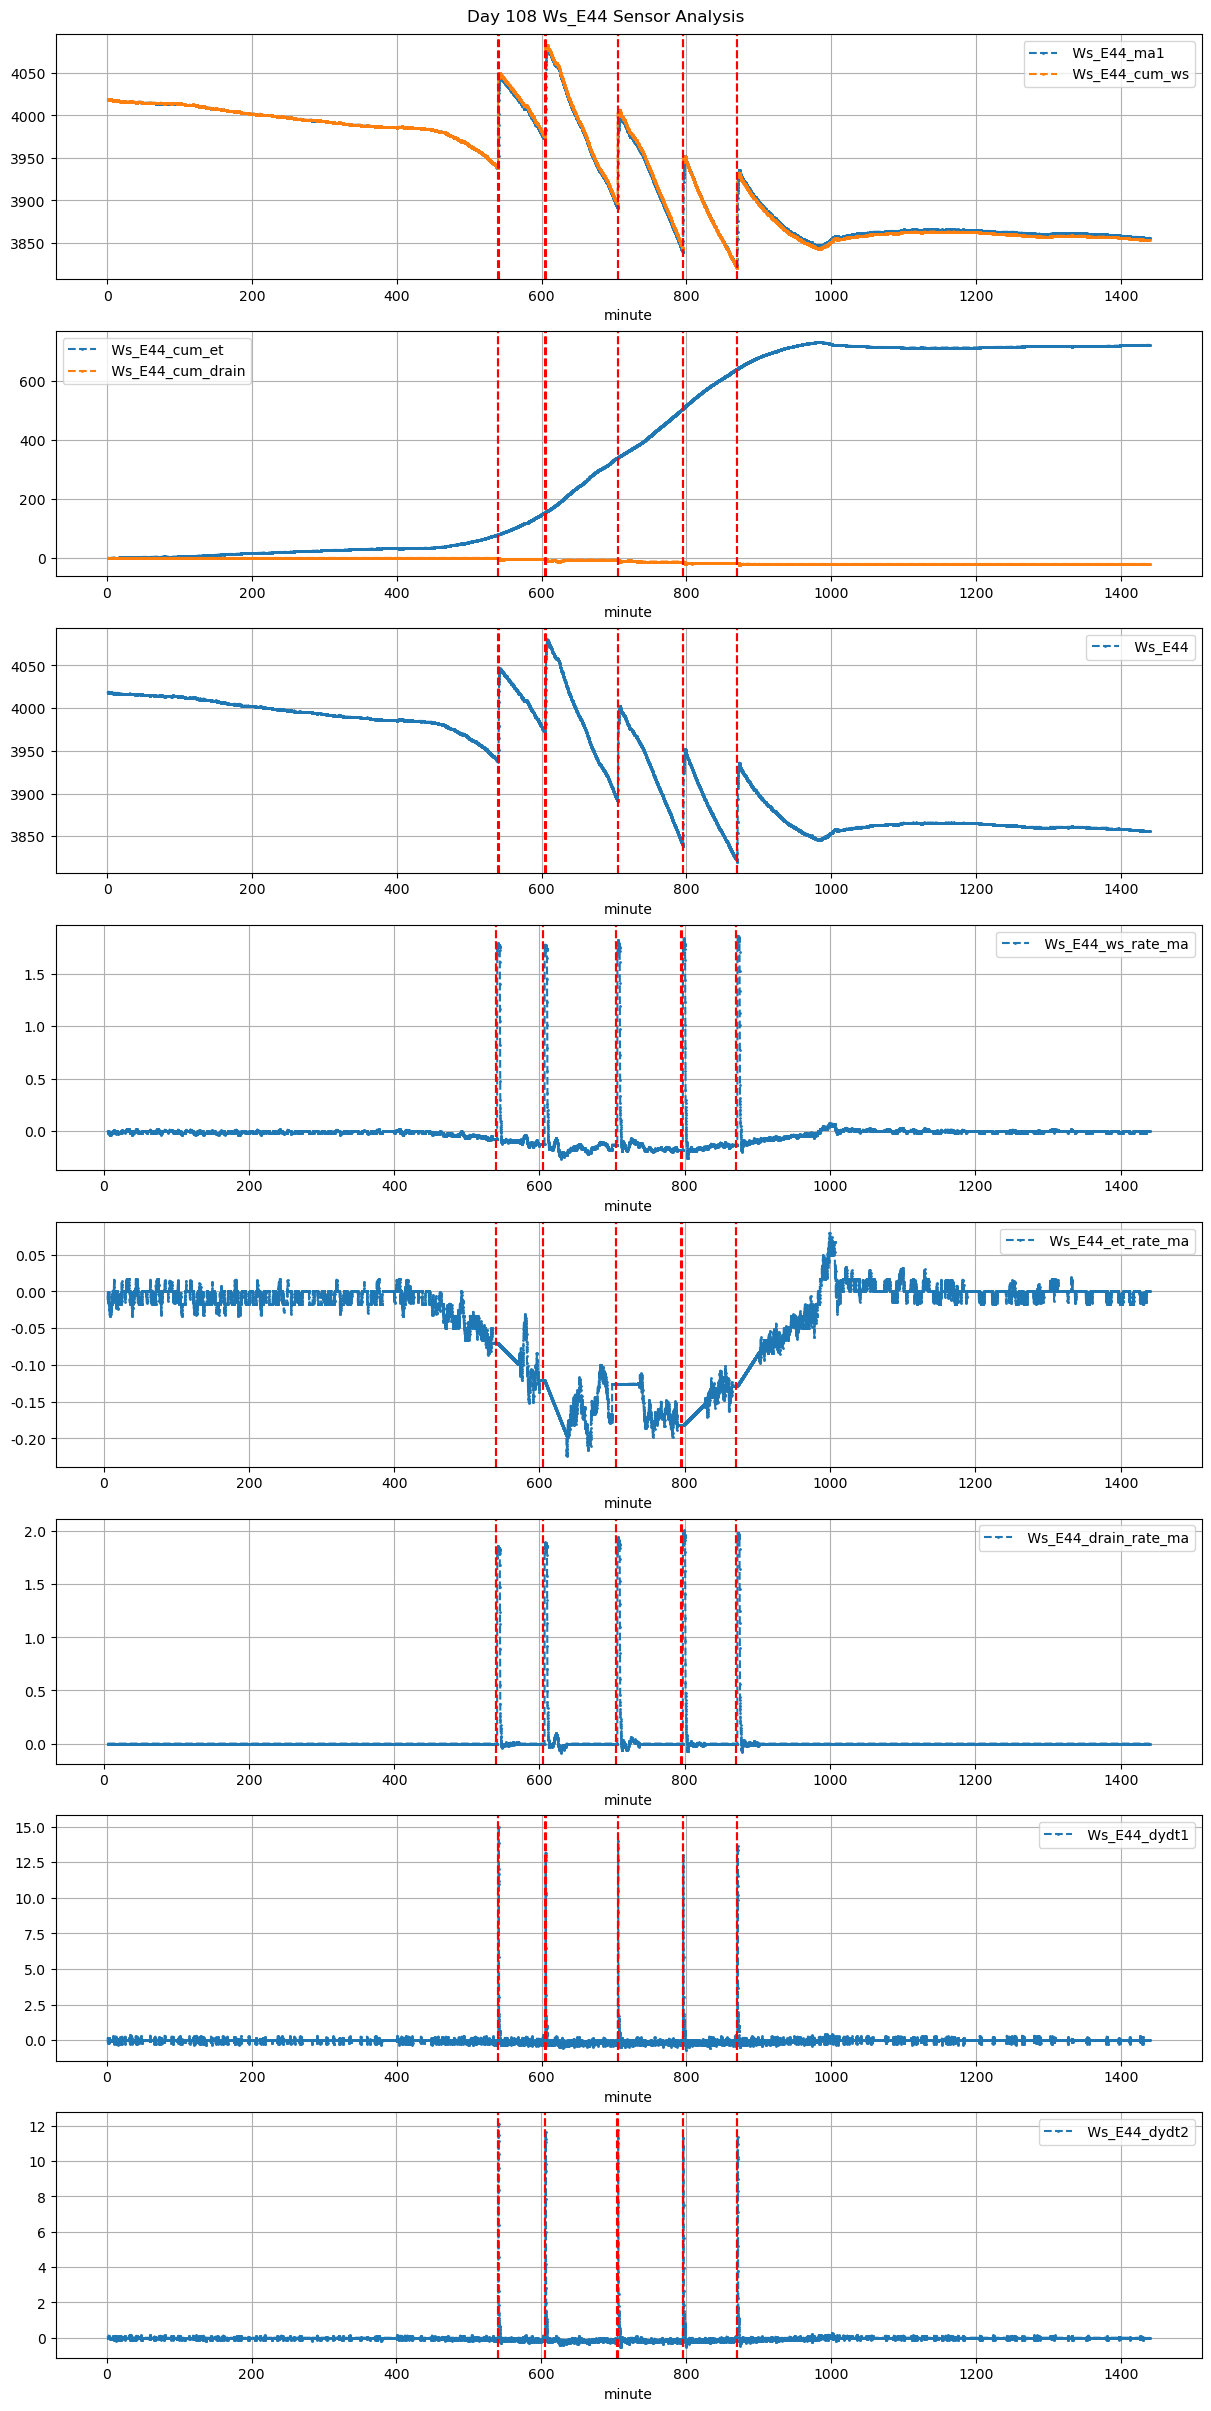
108 |
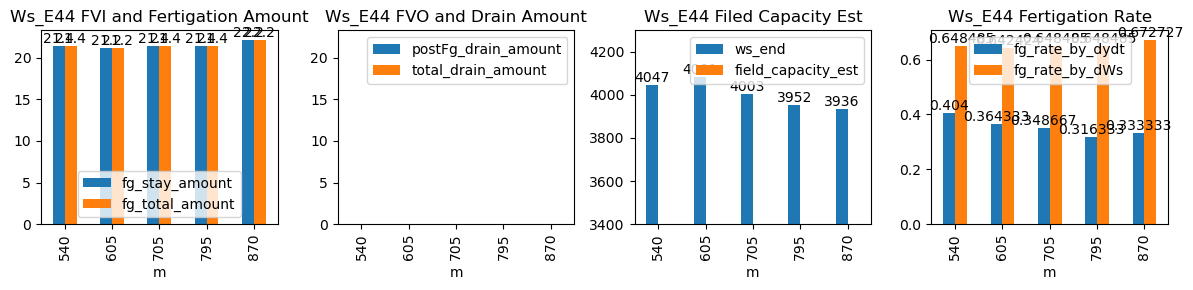
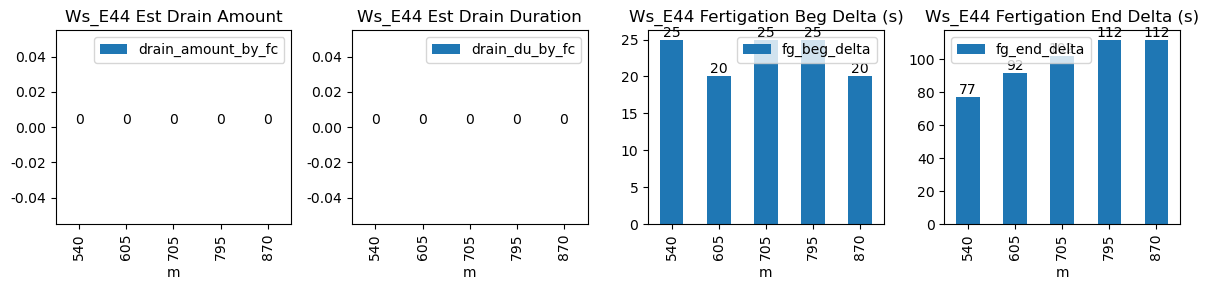
540 |
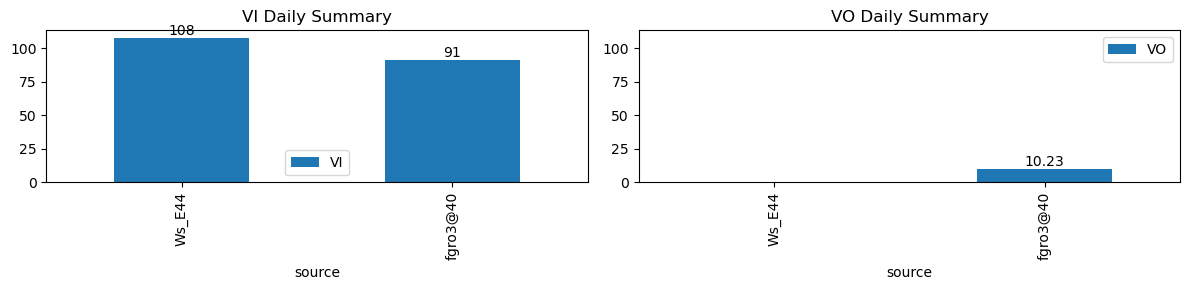
Ws_E44 |
0.376249 |
30 |
540.0 |
540.416667 |
540.55 |
541.833333 |
NaN |
NaN |
NaN |
3940.0 |
4047.0 |
33 |
-0.069745 |
-0.085278 |
-0.099306 |
0.404000 |
0.648485 |
21.4 |
25.0 |
77.0 |
21.4 |
0.0 |
-0.909469 |
NaN |
-0.909469 |
| 2026-01-22 10:05:00+08:00 |
108 |
605 |
Ws_E44 |
0.376249 |
30 |
605.0 |
605.333333 |
605.55 |
607.083333 |
NaN |
NaN |
NaN |
3975.0 |
4081.0 |
33 |
-0.121179 |
-0.147778 |
-0.195458 |
0.364333 |
0.642424 |
21.2 |
20.0 |
92.0 |
21.2 |
0.0 |
-0.459725 |
NaN |
-0.459725 |
| 2026-01-22 11:45:00+08:00 |
108 |
705 |
Ws_E44 |
0.376249 |
30 |
705.0 |
705.416667 |
705.55 |
707.250000 |
NaN |
NaN |
NaN |
3896.0 |
4003.0 |
33 |
-0.171299 |
-0.126250 |
-0.125255 |
0.348667 |
0.648485 |
21.4 |
25.0 |
102.0 |
21.4 |
0.0 |
-1.278094 |
NaN |
-1.278094 |
| 2026-01-22 13:15:00+08:00 |
108 |
795 |
Ws_E44 |
0.376249 |
30 |
795.0 |
795.416667 |
795.55 |
797.416667 |
NaN |
NaN |
NaN |
3845.0 |
3952.0 |
33 |
-0.182244 |
-0.186250 |
-0.153360 |
0.316333 |
0.648485 |
21.4 |
25.0 |
112.0 |
21.4 |
0.0 |
-0.967265 |
NaN |
-0.967265 |
| 2026-01-22 14:30:00+08:00 |
108 |
870 |
Ws_E44 |
0.376249 |
30 |
870.0 |
870.333333 |
870.55 |
872.416667 |
NaN |
NaN |
NaN |
3825.0 |
3936.0 |
33 |
-0.128366 |
-0.131806 |
-0.082222 |
0.333333 |
0.672727 |
22.2 |
20.0 |
112.0 |
22.2 |
0.0 |
-0.574392 |
NaN |
-0.574392 |