| 2026-01-28 11:10:00+08:00 |
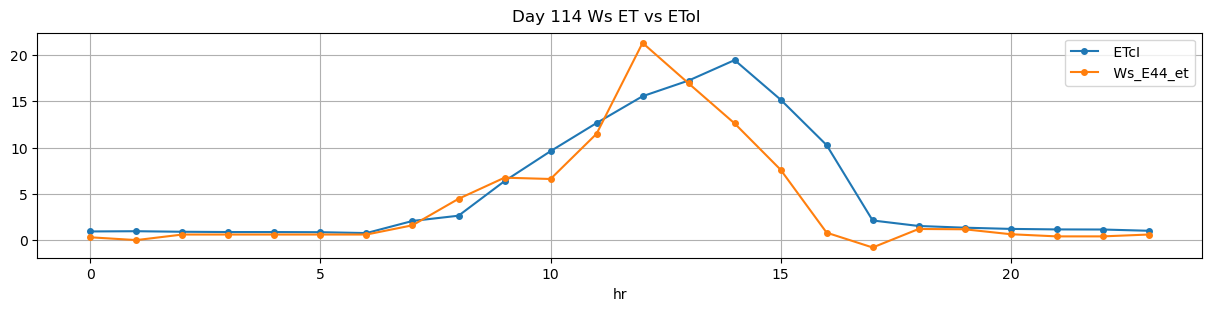
114 |
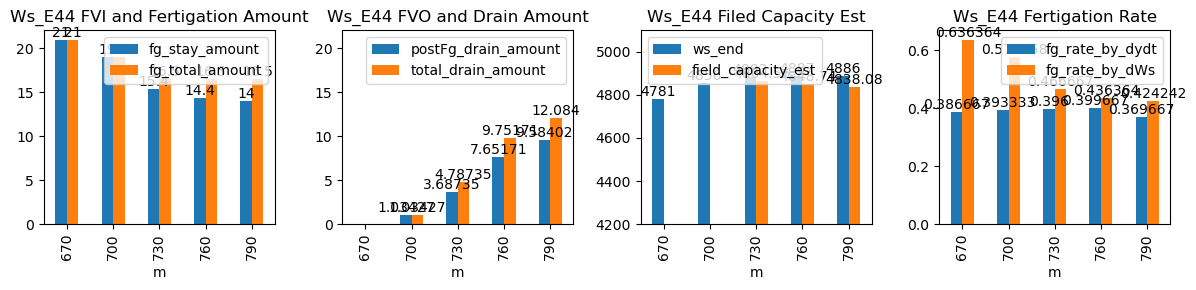
670 |
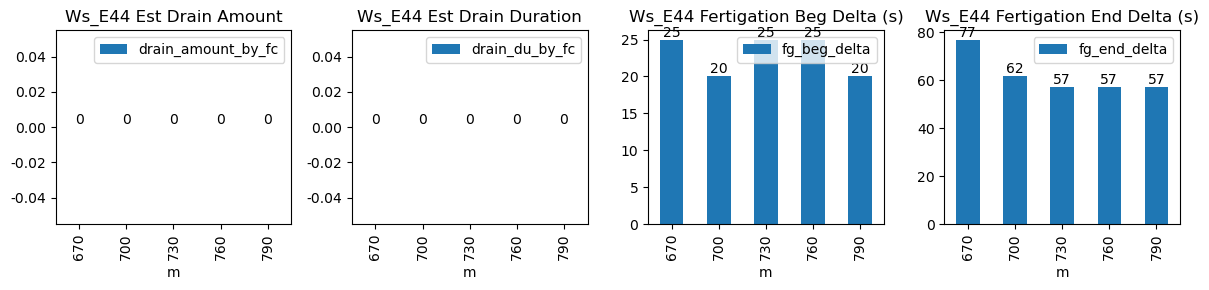
Ws_E44 |
0.883852 |
28.166667 |
670.0 |
670.416667 |
670.55 |
671.833333 |
NaN |
NaN |
NaN |
4676.0 |
4781.0 |
33 |
-0.053107 |
-0.052500 |
0.000000 |
0.386667 |
0.636364 |
21.0 |
25.0 |
77.0 |
21.0 |
0.0 |
-1.637915 |
NaN |
-1.637915 |
| 2026-01-28 11:40:00+08:00 |
114 |
700 |
Ws_E44 |
0.883852 |
28.416667 |
700.0 |
700.333333 |
700.55 |
701.583333 |
NaN |
NaN |
NaN |
4761.0 |
4856.0 |
33 |
-0.071766 |
-0.200000 |
0.000000 |
0.393333 |
0.575758 |
19.0 |
20.0 |
62.0 |
19.0 |
0.0 |
1.034268 |
NaN |
1.034268 |
| 2026-01-28 12:10:00+08:00 |
114 |
730 |
Ws_E44 |
0.883852 |
28.500000 |
730.0 |
730.416667 |
730.55 |
731.500000 |
NaN |
NaN |
NaN |
4806.0 |
4883.0 |
33 |
-0.190360 |
-0.267639 |
0.000000 |
0.396000 |
0.466667 |
15.4 |
25.0 |
57.0 |
16.5 |
1.1 |
3.687352 |
4864.563242 |
4.787352 |
| 2026-01-28 12:40:00+08:00 |
114 |
760 |
Ws_E44 |
0.883852 |
28.500000 |
760.0 |
760.416667 |
760.55 |
761.500000 |
NaN |
NaN |
NaN |
4815.0 |
4887.0 |
33 |
-0.129237 |
-0.295833 |
0.000000 |
0.399667 |
0.436364 |
14.4 |
25.0 |
57.0 |
16.5 |
2.1 |
7.651707 |
4848.741465 |
9.751707 |
| 2026-01-28 13:10:00+08:00 |
114 |
790 |
Ws_E44 |
0.883852 |
30.000000 |
790.0 |
790.333333 |
790.55 |
791.500000 |
NaN |
NaN |
NaN |
4816.0 |
4886.0 |
33 |
-0.096893 |
-0.328889 |
-0.146069 |
0.369667 |
0.424242 |
14.0 |
20.0 |
57.0 |
16.5 |
2.5 |
9.584019 |
4838.079904 |
12.084019 |