| 2026-01-27 10:40:00+08:00 |
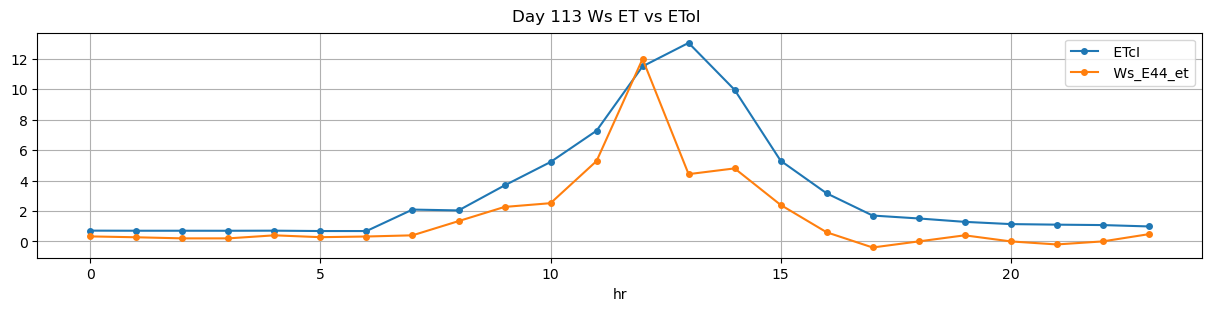
113 |
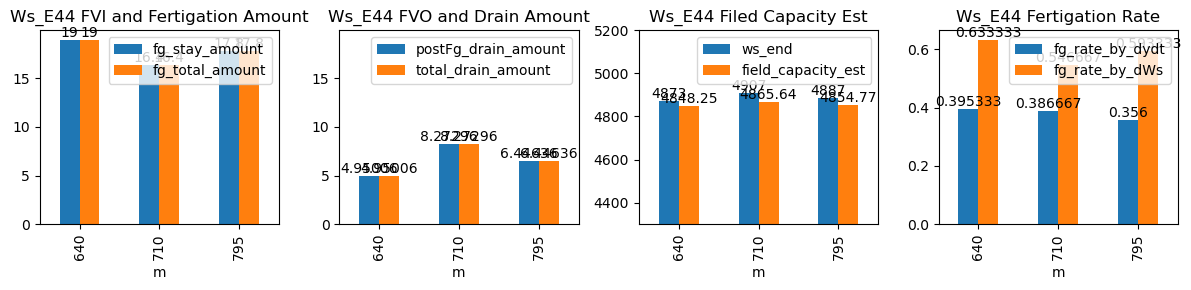
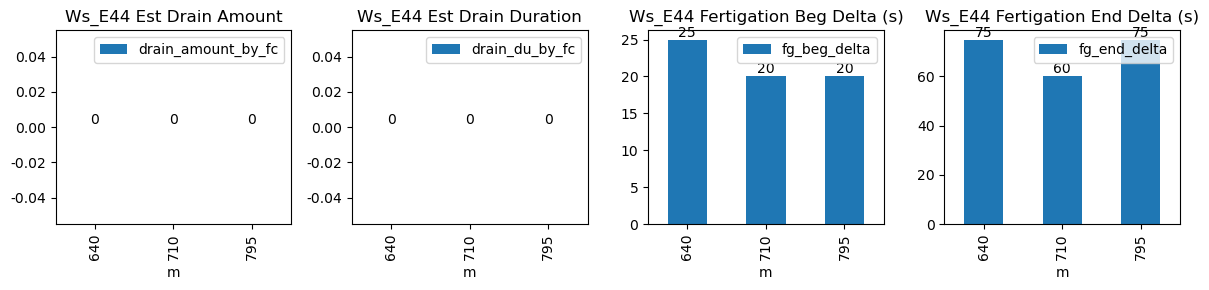
640 |
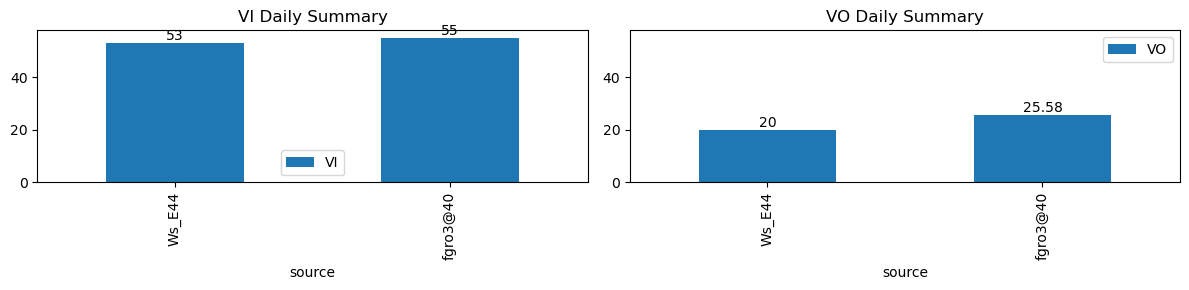
Ws_E44 |
0.413425 |
30 |
640.0 |
640.416667 |
640.5 |
641.75 |
NaN |
NaN |
NaN |
4778.0 |
4873.0 |
30 |
-0.008977 |
-0.166528 |
-0.027882 |
0.395333 |
0.633333 |
19.0 |
25.0 |
75.0 |
19.0 |
0.0 |
4.950056 |
4848.249721 |
4.950056 |
| 2026-01-27 11:50:00+08:00 |
113 |
710 |
Ws_E44 |
0.413425 |
30 |
710.0 |
710.333333 |
710.5 |
711.50 |
NaN |
NaN |
NaN |
4825.0 |
4907.0 |
30 |
-0.050196 |
-0.296806 |
-0.126389 |
0.386667 |
0.546667 |
16.4 |
20.0 |
60.0 |
16.4 |
0.0 |
8.272958 |
4865.635208 |
8.272958 |
| 2026-01-27 13:15:00+08:00 |
113 |
795 |
Ws_E44 |
0.413425 |
30 |
795.0 |
795.333333 |
795.5 |
796.75 |
NaN |
NaN |
NaN |
4798.0 |
4887.0 |
30 |
-0.011093 |
-0.190278 |
-0.057778 |
0.356000 |
0.593333 |
17.8 |
20.0 |
75.0 |
17.8 |
0.0 |
6.446364 |
4854.768178 |
6.446364 |