| 2026-01-17 09:10:00+08:00 |
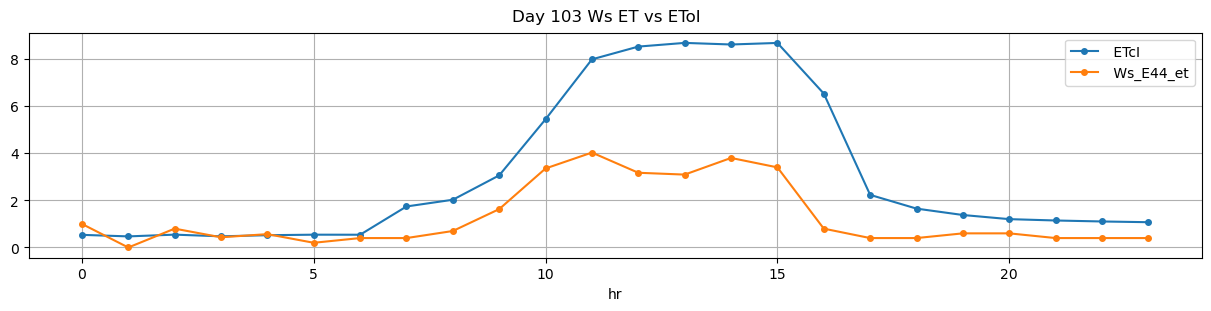
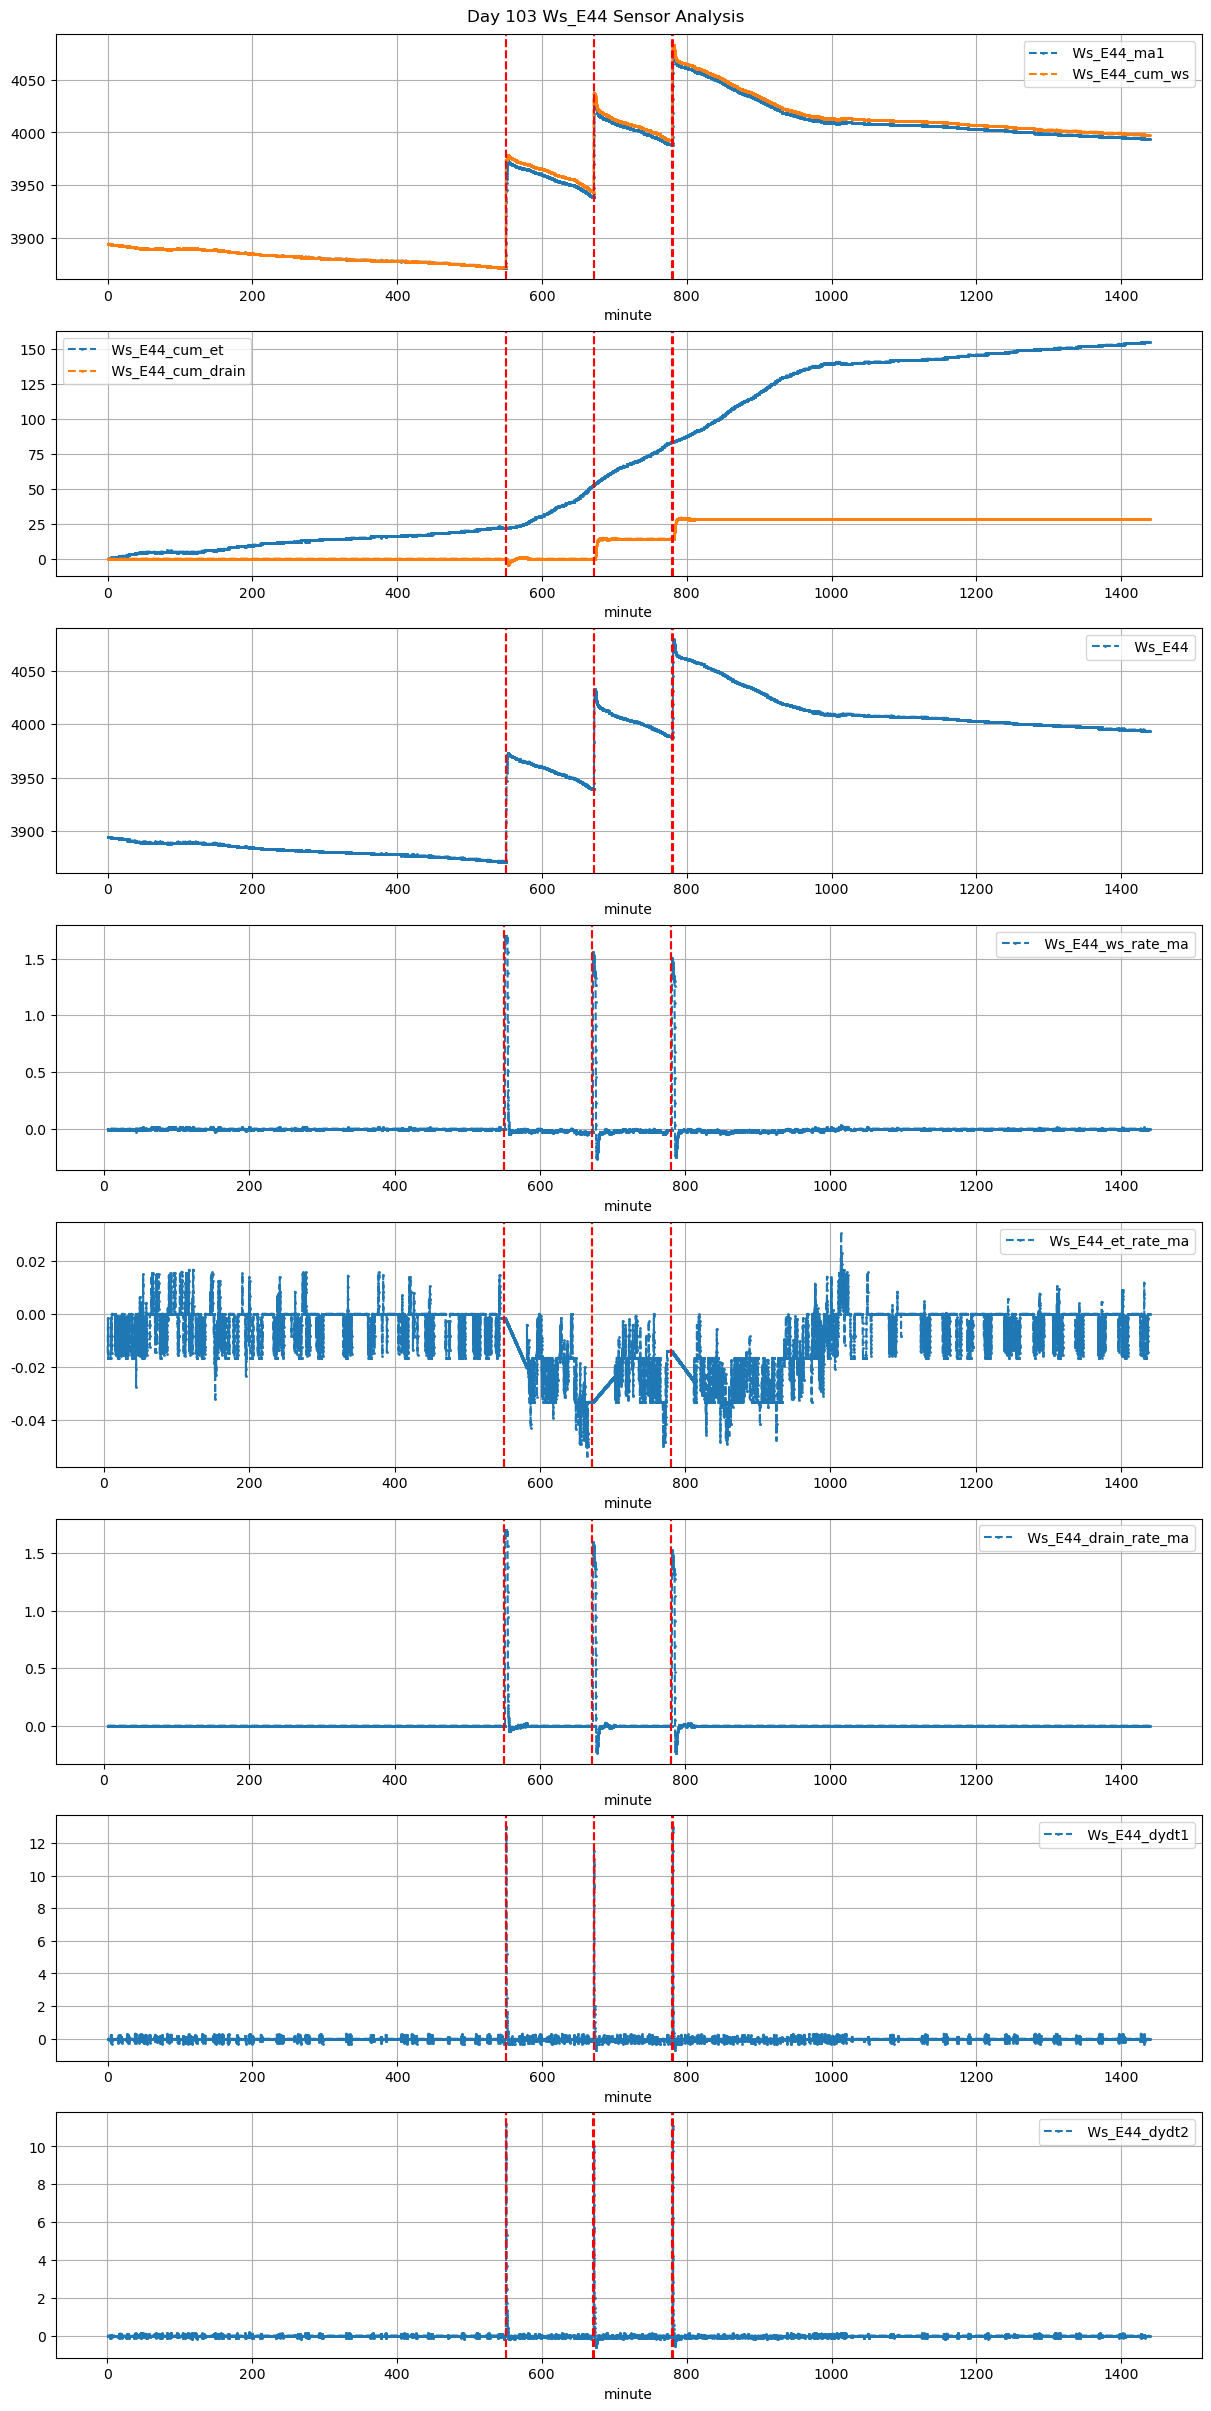
103 |
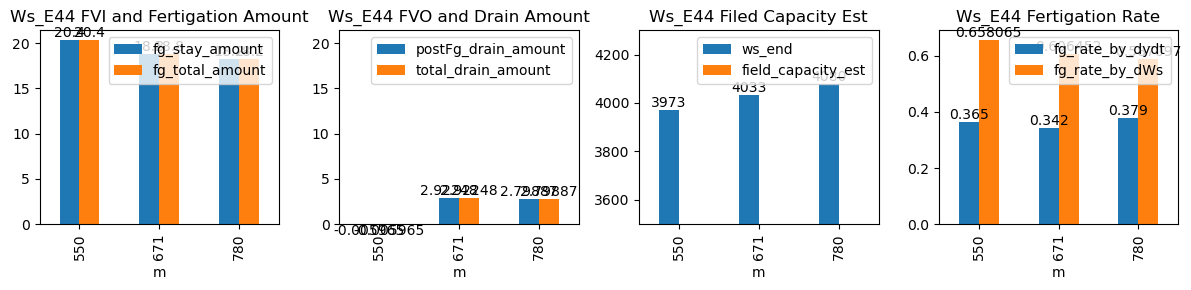
550 |
Ws_E44 |
0.209688 |
30 |
550.0 |
550.416667 |
550.52 |
552.083333 |
NaN |
NaN |
NaN |
3871.0 |
3973.0 |
31 |
-0.001695 |
-0.032639 |
-0.020417 |
0.365 |
0.658065 |
20.4 |
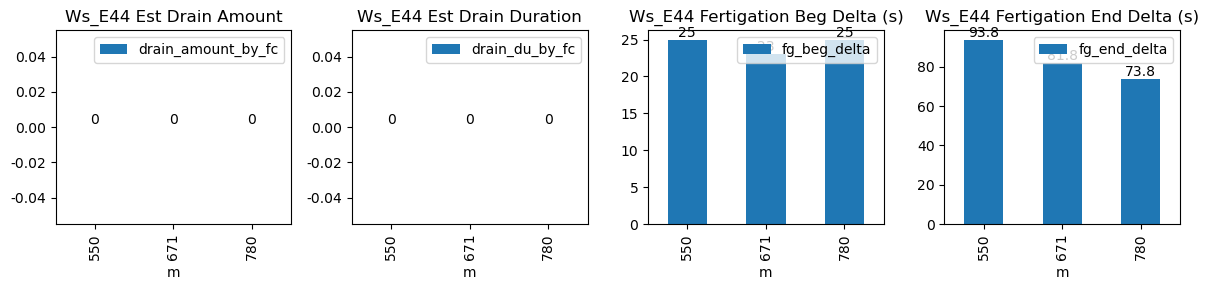
25.0 |
93.8 |
20.4 |
0.0 |
-0.005965 |
NaN |
-0.005965 |
| 2026-01-17 11:11:12+08:00 |
103 |
671 |
Ws_E44 |
0.209688 |
30 |
671.2 |
671.583333 |
671.72 |
673.083333 |
NaN |
NaN |
NaN |
3939.0 |
4033.0 |
31 |
-0.033306 |
-0.131528 |
-0.023611 |
0.342 |
0.606452 |
18.8 |
23.0 |
81.8 |
18.8 |
0.0 |
2.922478 |
NaN |
2.922478 |
| 2026-01-17 13:00:00+08:00 |
103 |
780 |
Ws_E44 |
0.209688 |
30 |
780.0 |
780.416667 |
780.52 |
781.750000 |
NaN |
NaN |
NaN |
3989.0 |
4080.0 |
31 |
-0.014266 |
-0.116667 |
-0.025417 |
0.379 |
0.587097 |
18.2 |
25.0 |
73.8 |
18.2 |
0.0 |
2.798867 |
NaN |
2.798867 |