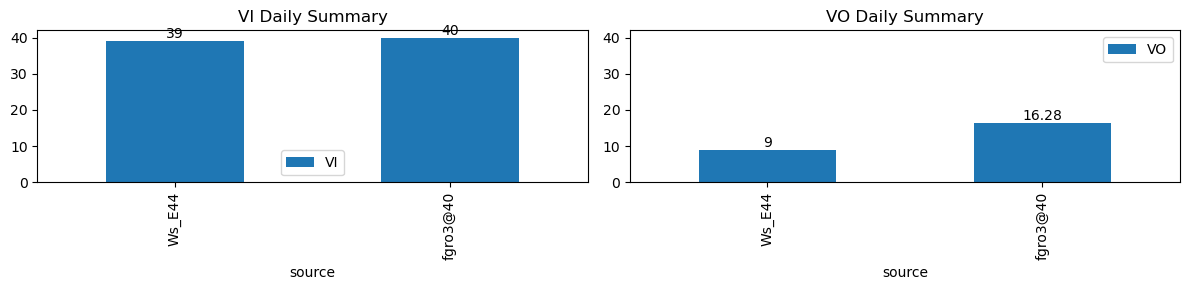
VI and VO Daily Summary
| ws_name | total_dp | nan_dp | nan_filled_dp | long_gap_dp | num_spike |
|---|---|---|---|---|---|
| Ws_E44 | 17269 | 0 | 14566 | 0 | 0 |
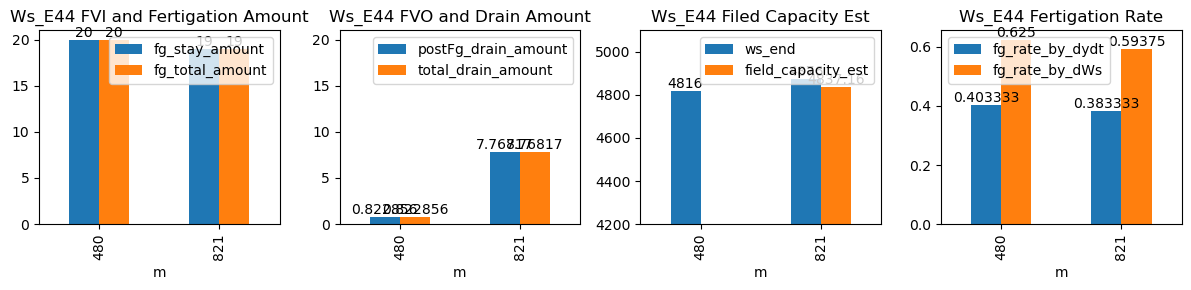
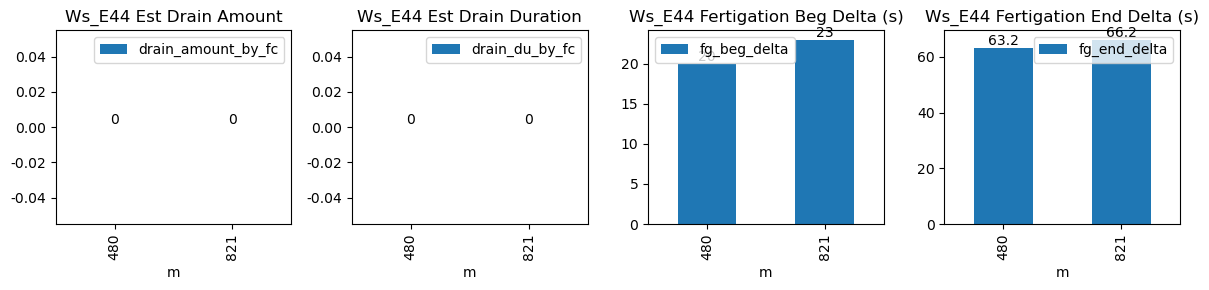
| ds | d | m | ws_name | prominence_cut | max_drain_du | fg_beg | fg_beg_est | fg_end | fg_end_est | drain_amount_by_fc | drain_du_by_fc | drain_rate_by_fc | ws_beg | ws_end | duc | pre_fg_et | post_fg_ws | post_drn_et | fg_rate_by_dydt | fg_rate_by_dWs | fg_stay_amount | fg_beg_delta | fg_end_delta | fg_total_amount | fg_drain_amount | postFg_drain_amount | field_capacity_est | total_drain_amount |
|---|---|---|---|---|---|---|---|---|---|---|---|---|---|---|---|---|---|---|---|---|---|---|---|---|---|---|---|---|
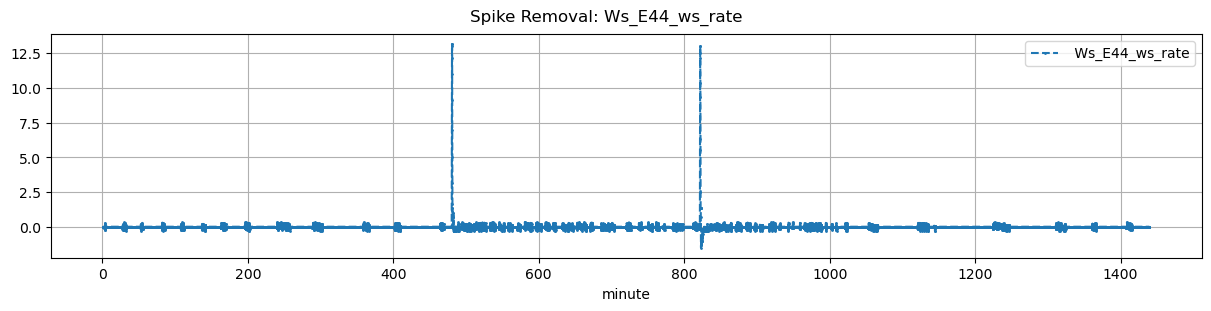
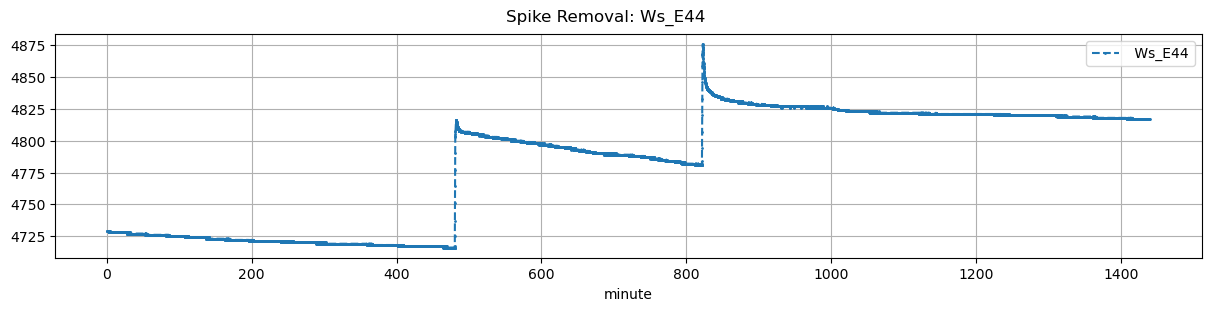
| 2026-01-26 08:00:00+08:00 | 112 | 480 | Ws_E44 | 0.244688 | 30 | 480.0 | 480.333333 | 480.53 | 481.583333 | NaN | NaN | NaN | 4716.0 | 4816.0 | 32 | 0.000000 | -0.067083 | -0.006713 | 0.403333 | 0.62500 | 20.0 | 20.0 | 63.2 | 20.0 | 0.0 | 0.822856 | NaN | 0.822856 |
| 2026-01-26 13:41:12+08:00 | 112 | 821 | Ws_E44 | 0.244688 | 30 | 821.2 | 821.583333 | 821.73 | 822.833333 | NaN | NaN | NaN | 4781.0 | 4876.0 | 32 | -0.007847 | -0.211111 | -0.010394 | 0.383333 | 0.59375 | 19.0 | 23.0 | 66.2 | 19.0 | 0.0 | 7.768168 | 4837.159161 | 7.768168 |