| 2026-01-25 08:02:15+08:00 |
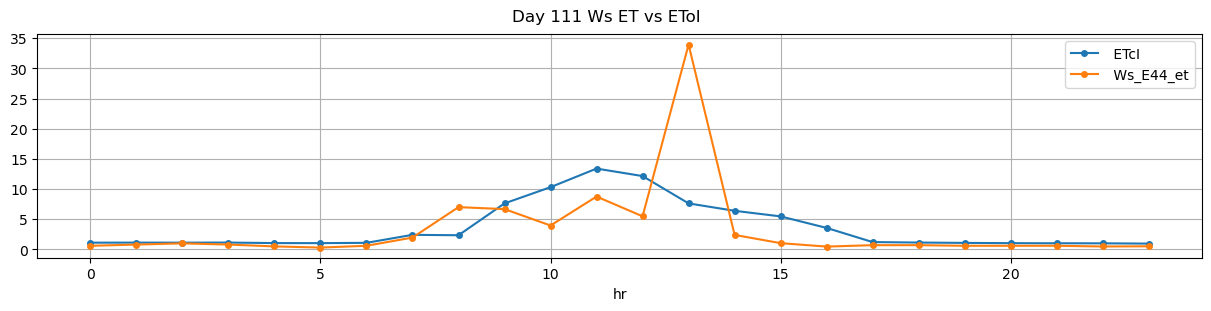
111 |
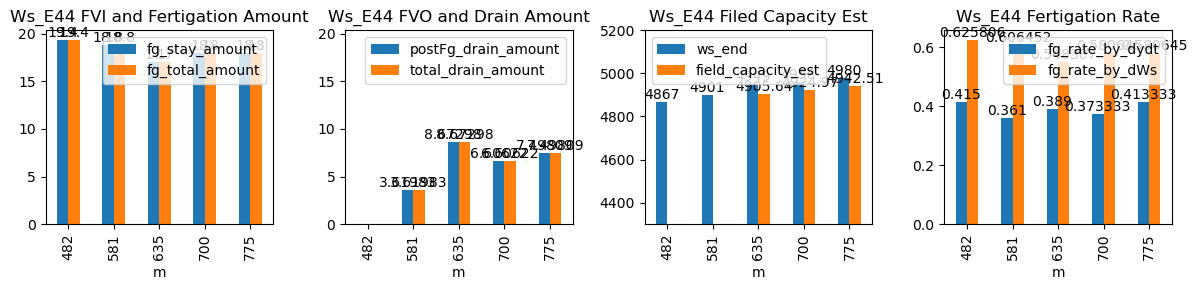
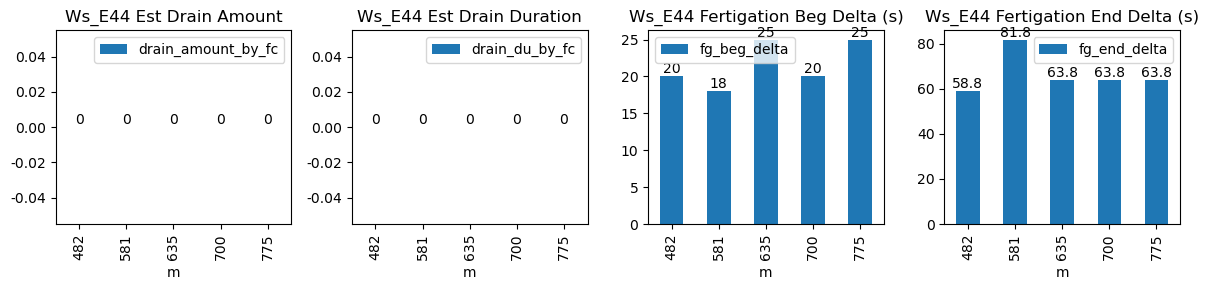
482 |
Ws_E44 |
5.537631 |
30 |
482.25 |
482.583333 |
482.77 |
483.750000 |
NaN |
NaN |
NaN |
4770.0 |
4867.0 |
31 |
-0.024153 |
-0.034722 |
-0.058194 |
0.415000 |
0.625806 |
19.4 |
20.0 |
58.8 |
19.4 |
0.0 |
-1.193584 |
NaN |
-1.193584 |
| 2026-01-25 09:41:12+08:00 |
111 |
581 |
Ws_E44 |
5.537631 |
30 |
581.20 |
581.500000 |
581.72 |
583.083333 |
NaN |
NaN |
NaN |
4807.0 |
4901.0 |
31 |
-0.022500 |
-0.147778 |
-0.044506 |
0.361000 |
0.606452 |
18.8 |
18.0 |
81.8 |
18.8 |
0.0 |
3.619833 |
NaN |
3.619833 |
| 2026-01-25 10:35:00+08:00 |
111 |
635 |
Ws_E44 |
5.537631 |
30 |
635.00 |
635.416667 |
635.52 |
636.583333 |
NaN |
NaN |
NaN |
4864.0 |
4949.0 |
31 |
-0.004843 |
-0.226528 |
-0.053864 |
0.389000 |
0.548387 |
17.0 |
25.0 |
63.8 |
17.0 |
0.0 |
8.672979 |
4905.635103 |
8.672979 |
| 2026-01-25 11:40:00+08:00 |
111 |
700 |
Ws_E44 |
5.537631 |
30 |
700.00 |
700.333333 |
700.52 |
701.583333 |
NaN |
NaN |
NaN |
4868.0 |
4958.0 |
31 |
-0.047387 |
-0.236250 |
-0.043194 |
0.373333 |
0.580645 |
18.0 |
20.0 |
63.8 |
18.0 |
0.0 |
6.606219 |
4924.968907 |
6.606219 |
| 2026-01-25 12:55:00+08:00 |
111 |
775 |
Ws_E44 |
5.537631 |
30 |
775.00 |
775.416667 |
775.52 |
776.583333 |
NaN |
NaN |
NaN |
4890.0 |
4980.0 |
31 |
-0.031517 |
-0.247361 |
-0.029278 |
0.413333 |
0.580645 |
18.0 |
25.0 |
63.8 |
18.0 |
0.0 |
7.498091 |
4942.509547 |
7.498091 |