VI and VO Daily Summary
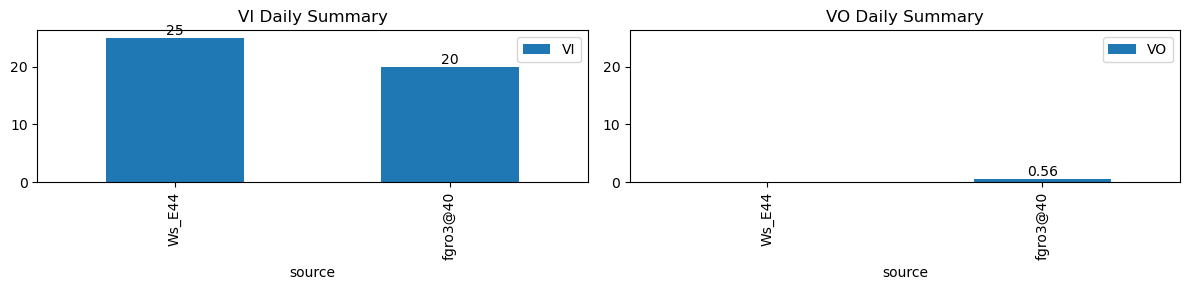
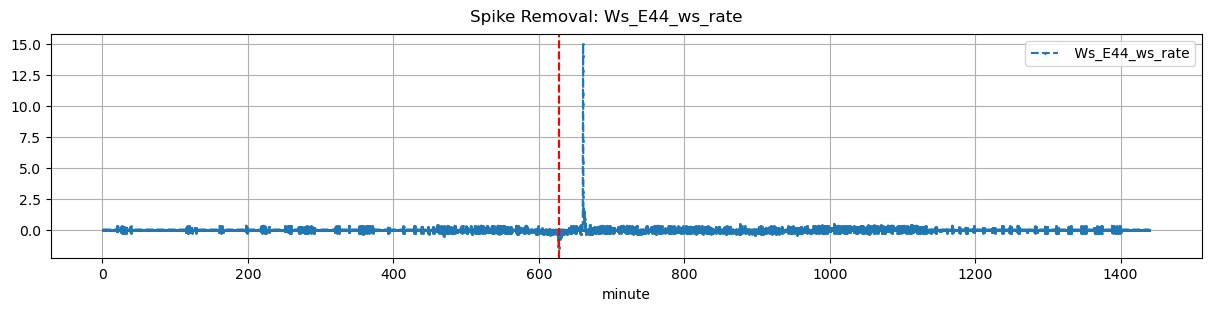
| ws_name | total_dp | nan_dp | nan_filled_dp | long_gap_dp | num_spike |
|---|---|---|---|---|---|
| Ws_E44 | 17268 | 0 | 14302 | 0 | 0 |
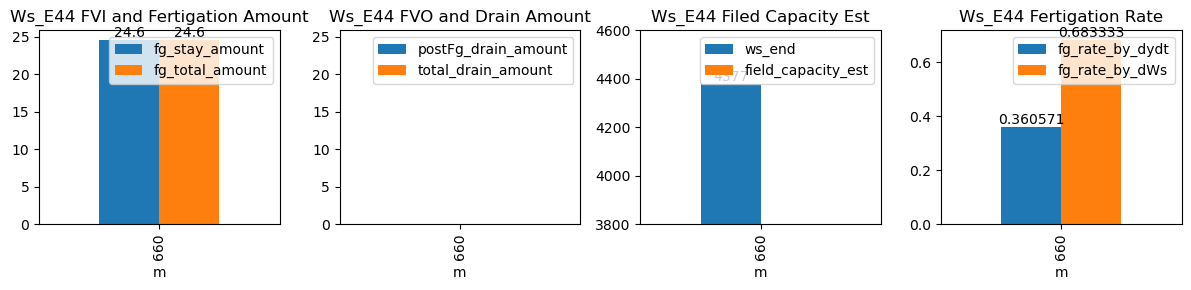
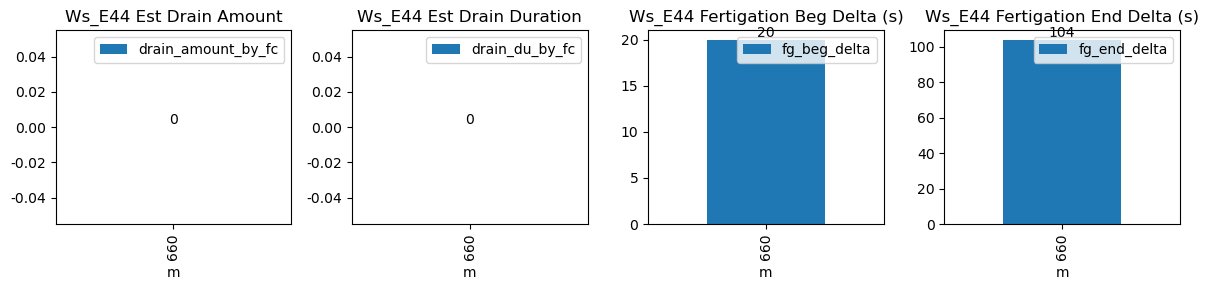
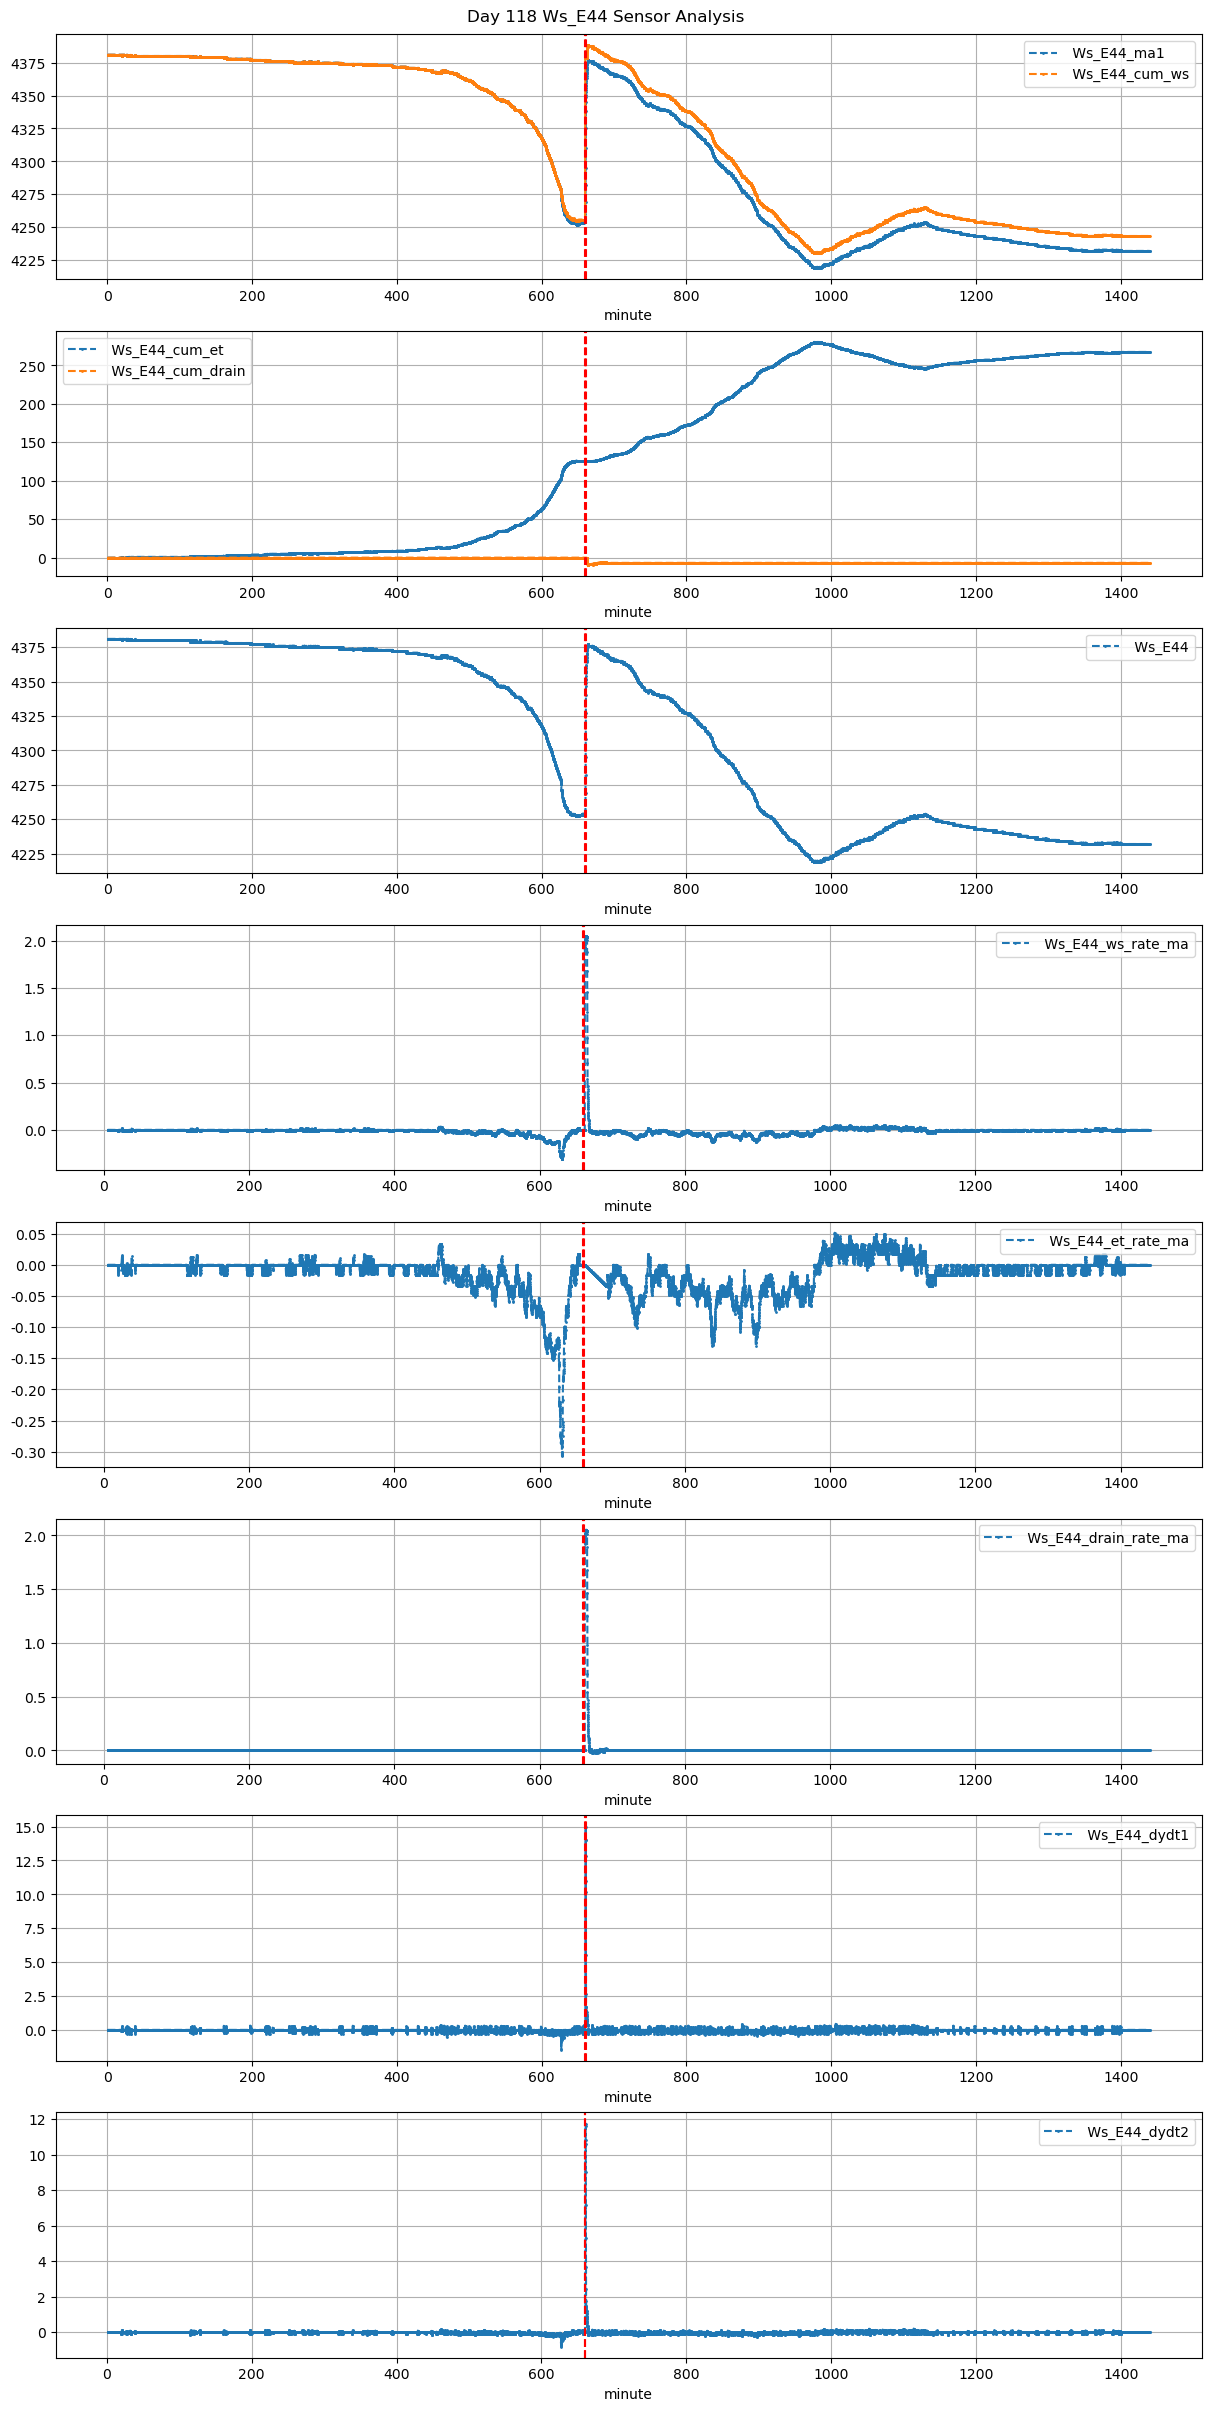
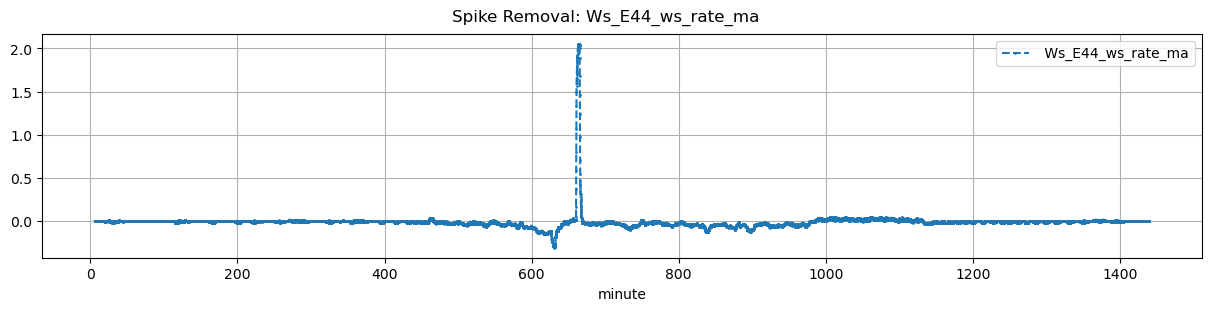
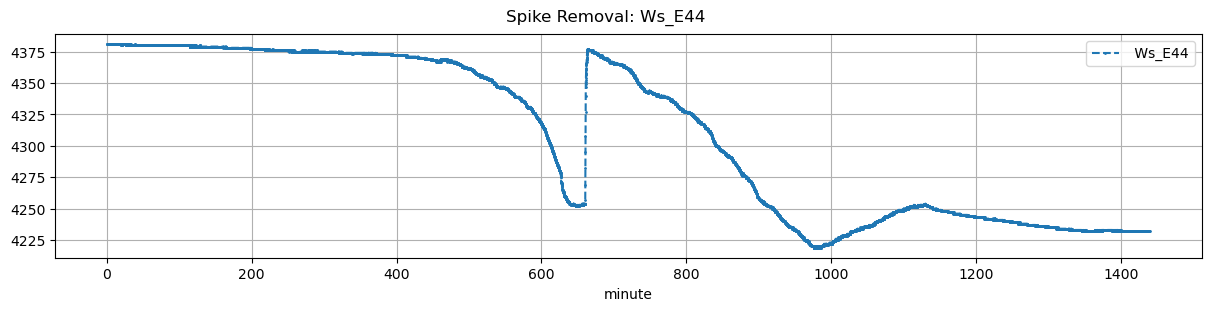
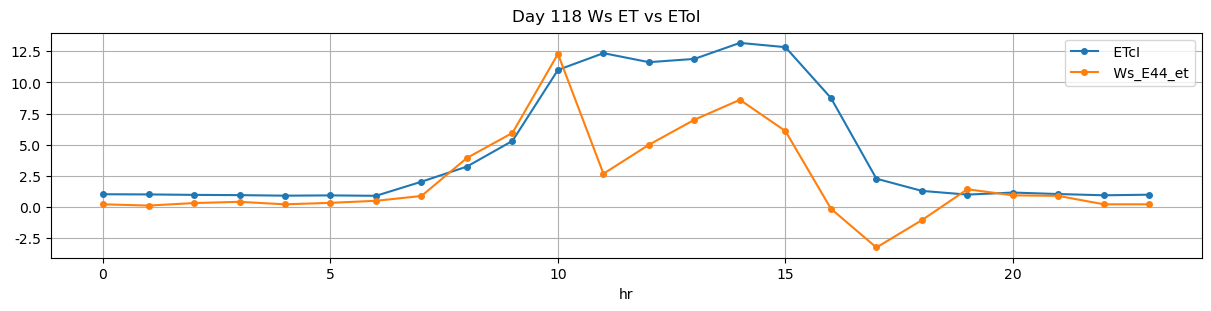
| ds | d | m | ws_name | prominence_cut | max_drain_du | fg_beg | fg_beg_est | fg_end | fg_end_est | drain_amount_by_fc | drain_du_by_fc | drain_rate_by_fc | ws_beg | ws_end | duc | pre_fg_et | post_fg_ws | post_drn_et | fg_rate_by_dydt | fg_rate_by_dWs | fg_stay_amount | fg_beg_delta | fg_end_delta | fg_total_amount | fg_drain_amount | postFg_drain_amount | field_capacity_est | total_drain_amount |
|---|---|---|---|---|---|---|---|---|---|---|---|---|---|---|---|---|---|---|---|---|---|---|---|---|---|---|---|---|
| 2026-02-01 11:00:00+08:00 | 118 | 660 | Ws_E44 | 0.232278 | 30 | 660.0 | 660.333333 | 660.6 | 662.333333 | NaN | NaN | NaN | 4254.0 | 4377.0 | 36 | 0.0 | 0.0 | -0.034745 | 0.360571 | 0.683333 | 24.6 | 20.0 | 104.0 | 24.6 | 0.0 | -1.378014 | NaN | -1.378014 |