| 2026-02-02 10:00:00+08:00 |
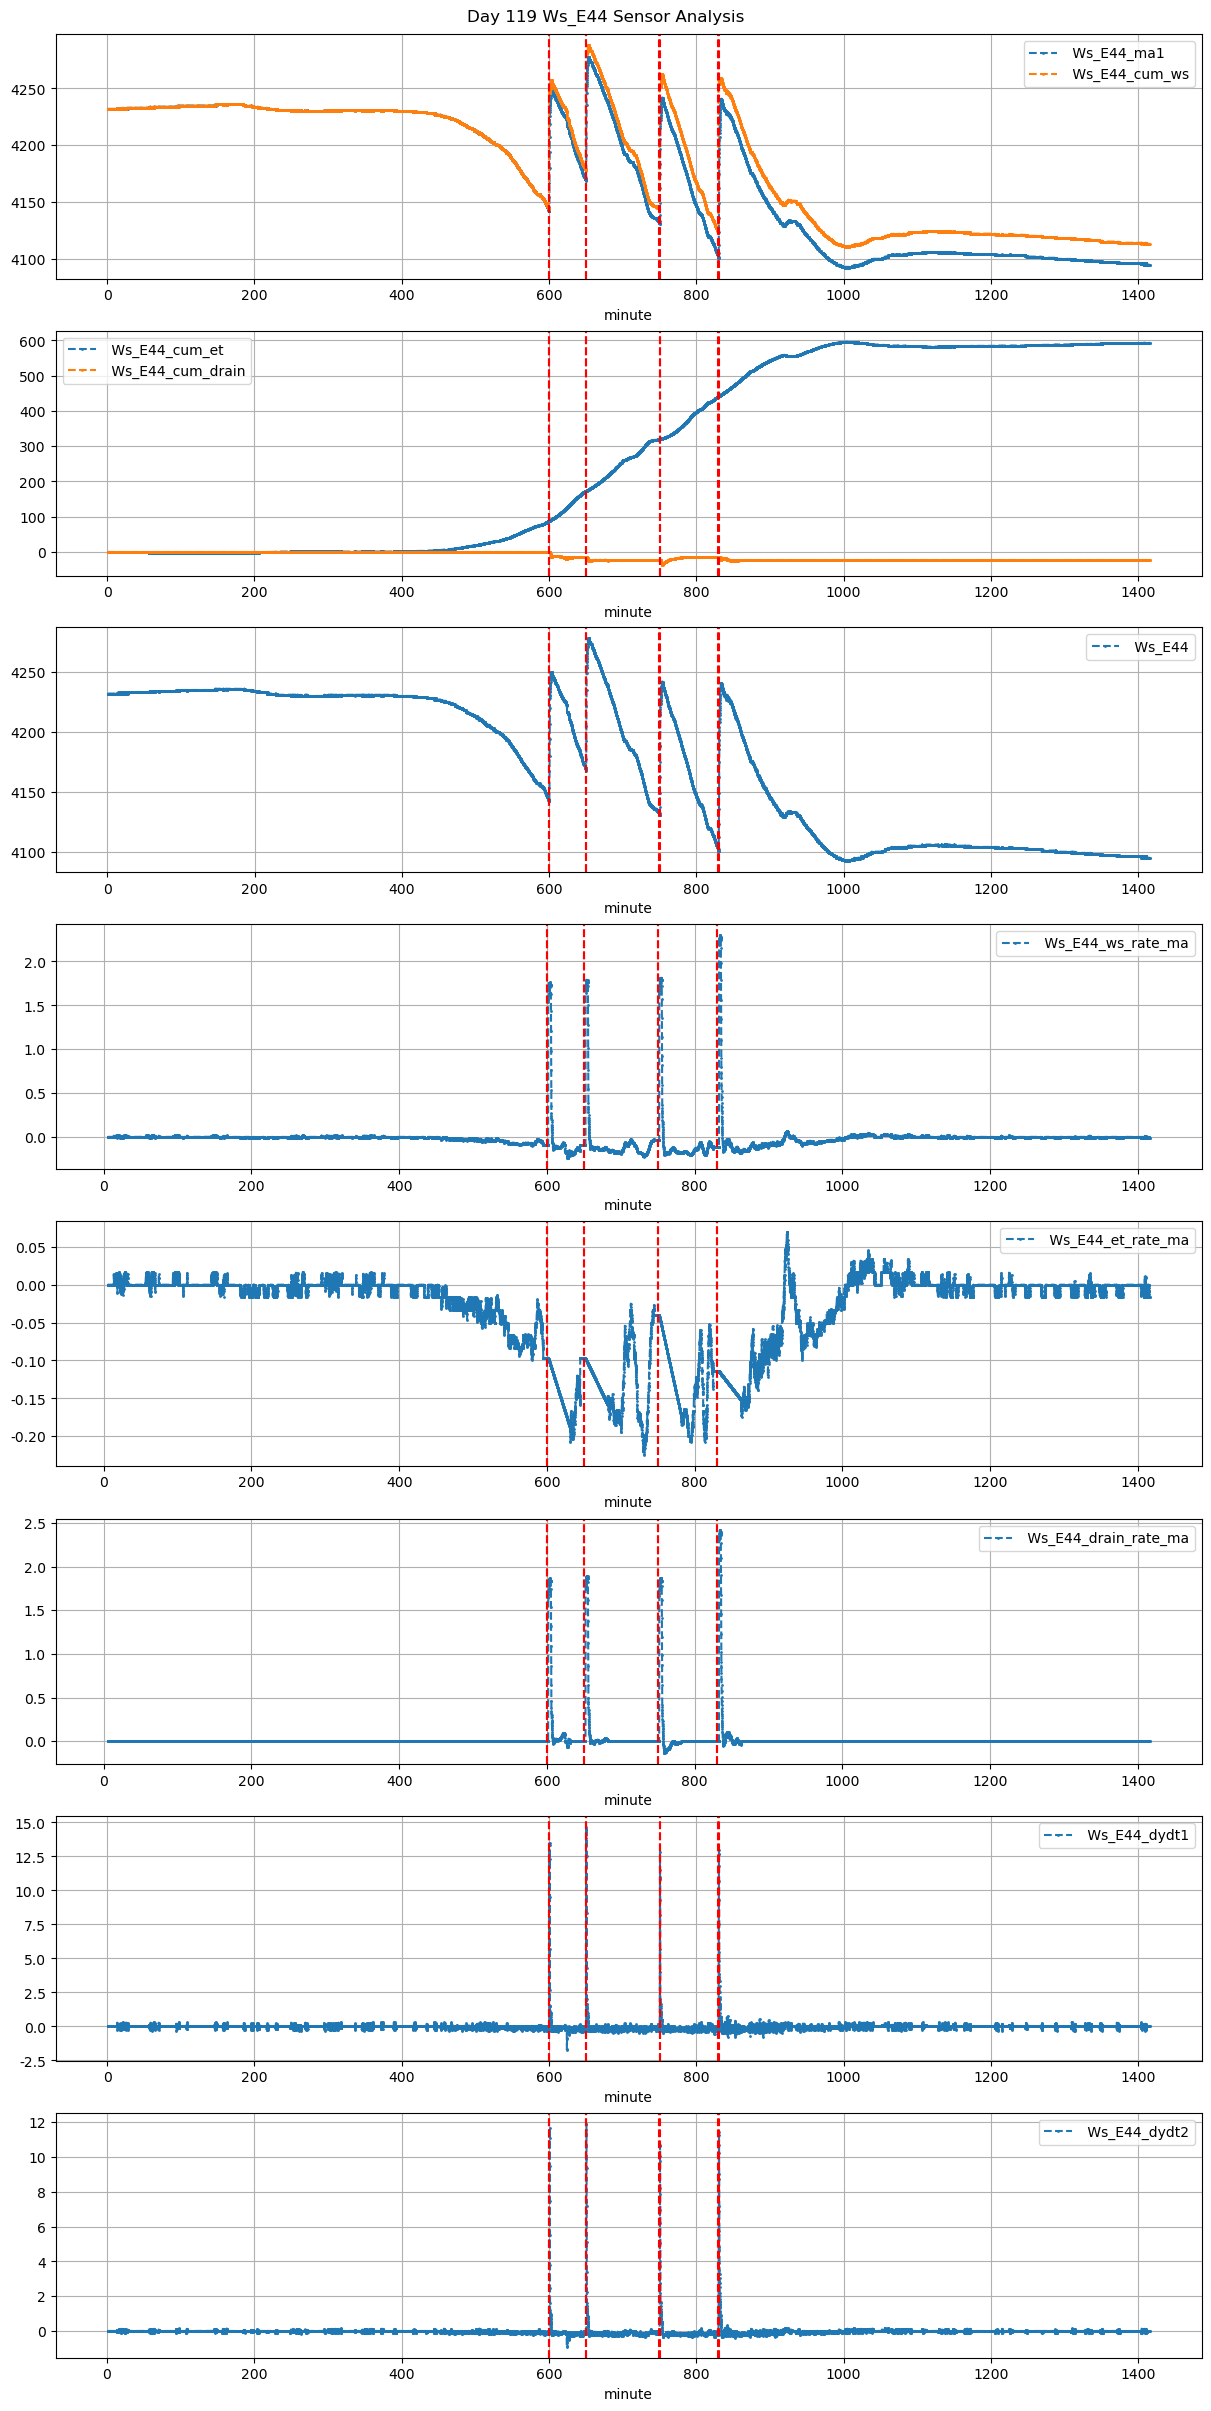
119 |
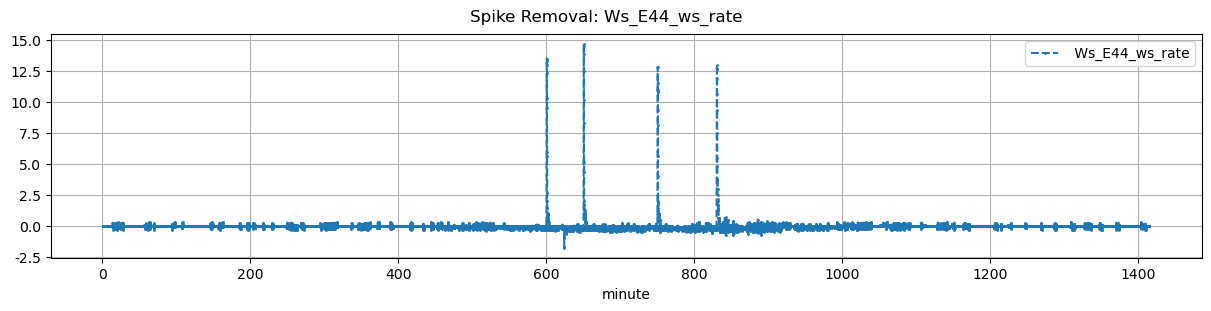
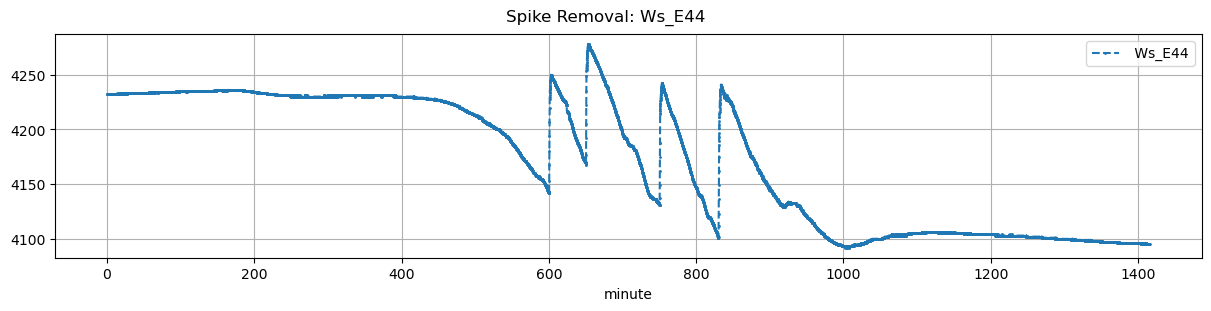
600 |
Ws_E44 |
0.355454 |
30 |
600.0 |
600.333333 |
600.53 |
601.750000 |
NaN |
NaN |
NaN |
4146.0 |
4250.0 |
32 |
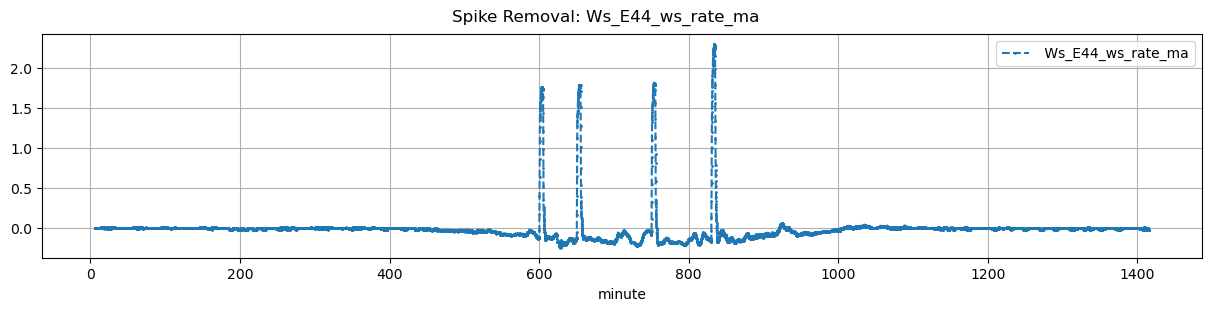
-0.109397 |
-0.096250 |
-0.190139 |
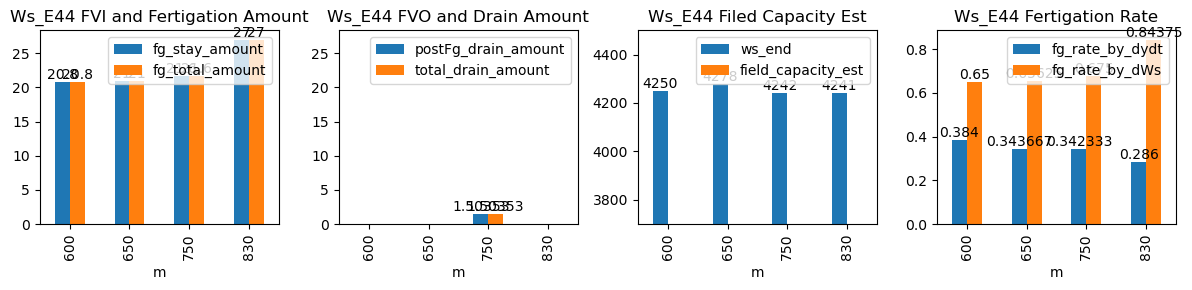
0.384000 |
0.65000 |
20.8 |
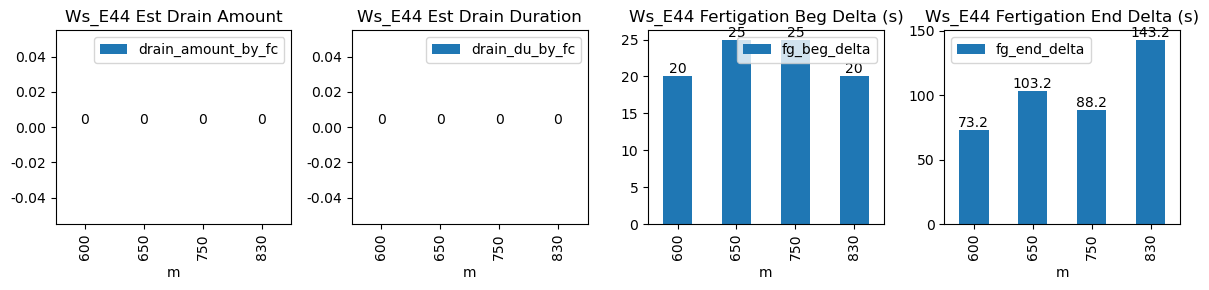
20.0 |
73.2 |
20.8 |
0.0 |
-3.275928 |
NaN |
-3.275928 |
| 2026-02-02 10:50:00+08:00 |
119 |
650 |
Ws_E44 |
0.355454 |
30 |
650.0 |
650.416667 |
650.53 |
652.250000 |
NaN |
NaN |
NaN |
4173.0 |
4278.0 |
32 |
-0.157298 |
-0.097361 |
-0.158333 |
0.343667 |
0.65625 |
21.0 |
25.0 |
103.2 |
21.0 |
0.0 |
-1.643085 |
NaN |
-1.643085 |
| 2026-02-02 12:30:00+08:00 |
119 |
750 |
Ws_E44 |
0.355454 |
30 |
750.0 |
750.416667 |
750.53 |
752.000000 |
NaN |
NaN |
NaN |
4134.0 |
4242.0 |
32 |
-0.040364 |
-0.156528 |
-0.174236 |
0.342333 |
0.67500 |
21.6 |
25.0 |
88.2 |
21.6 |
0.0 |
1.503528 |
NaN |
1.503528 |
| 2026-02-02 13:50:00+08:00 |
119 |
830 |
Ws_E44 |
0.355454 |
30 |
830.0 |
830.333333 |
830.53 |
832.916667 |
NaN |
NaN |
NaN |
4106.0 |
4241.0 |
32 |
-0.139141 |
-0.114444 |
-0.152037 |
0.286000 |
0.84375 |
27.0 |
20.0 |
143.2 |
27.0 |
0.0 |
-1.563539 |
NaN |
-1.563539 |