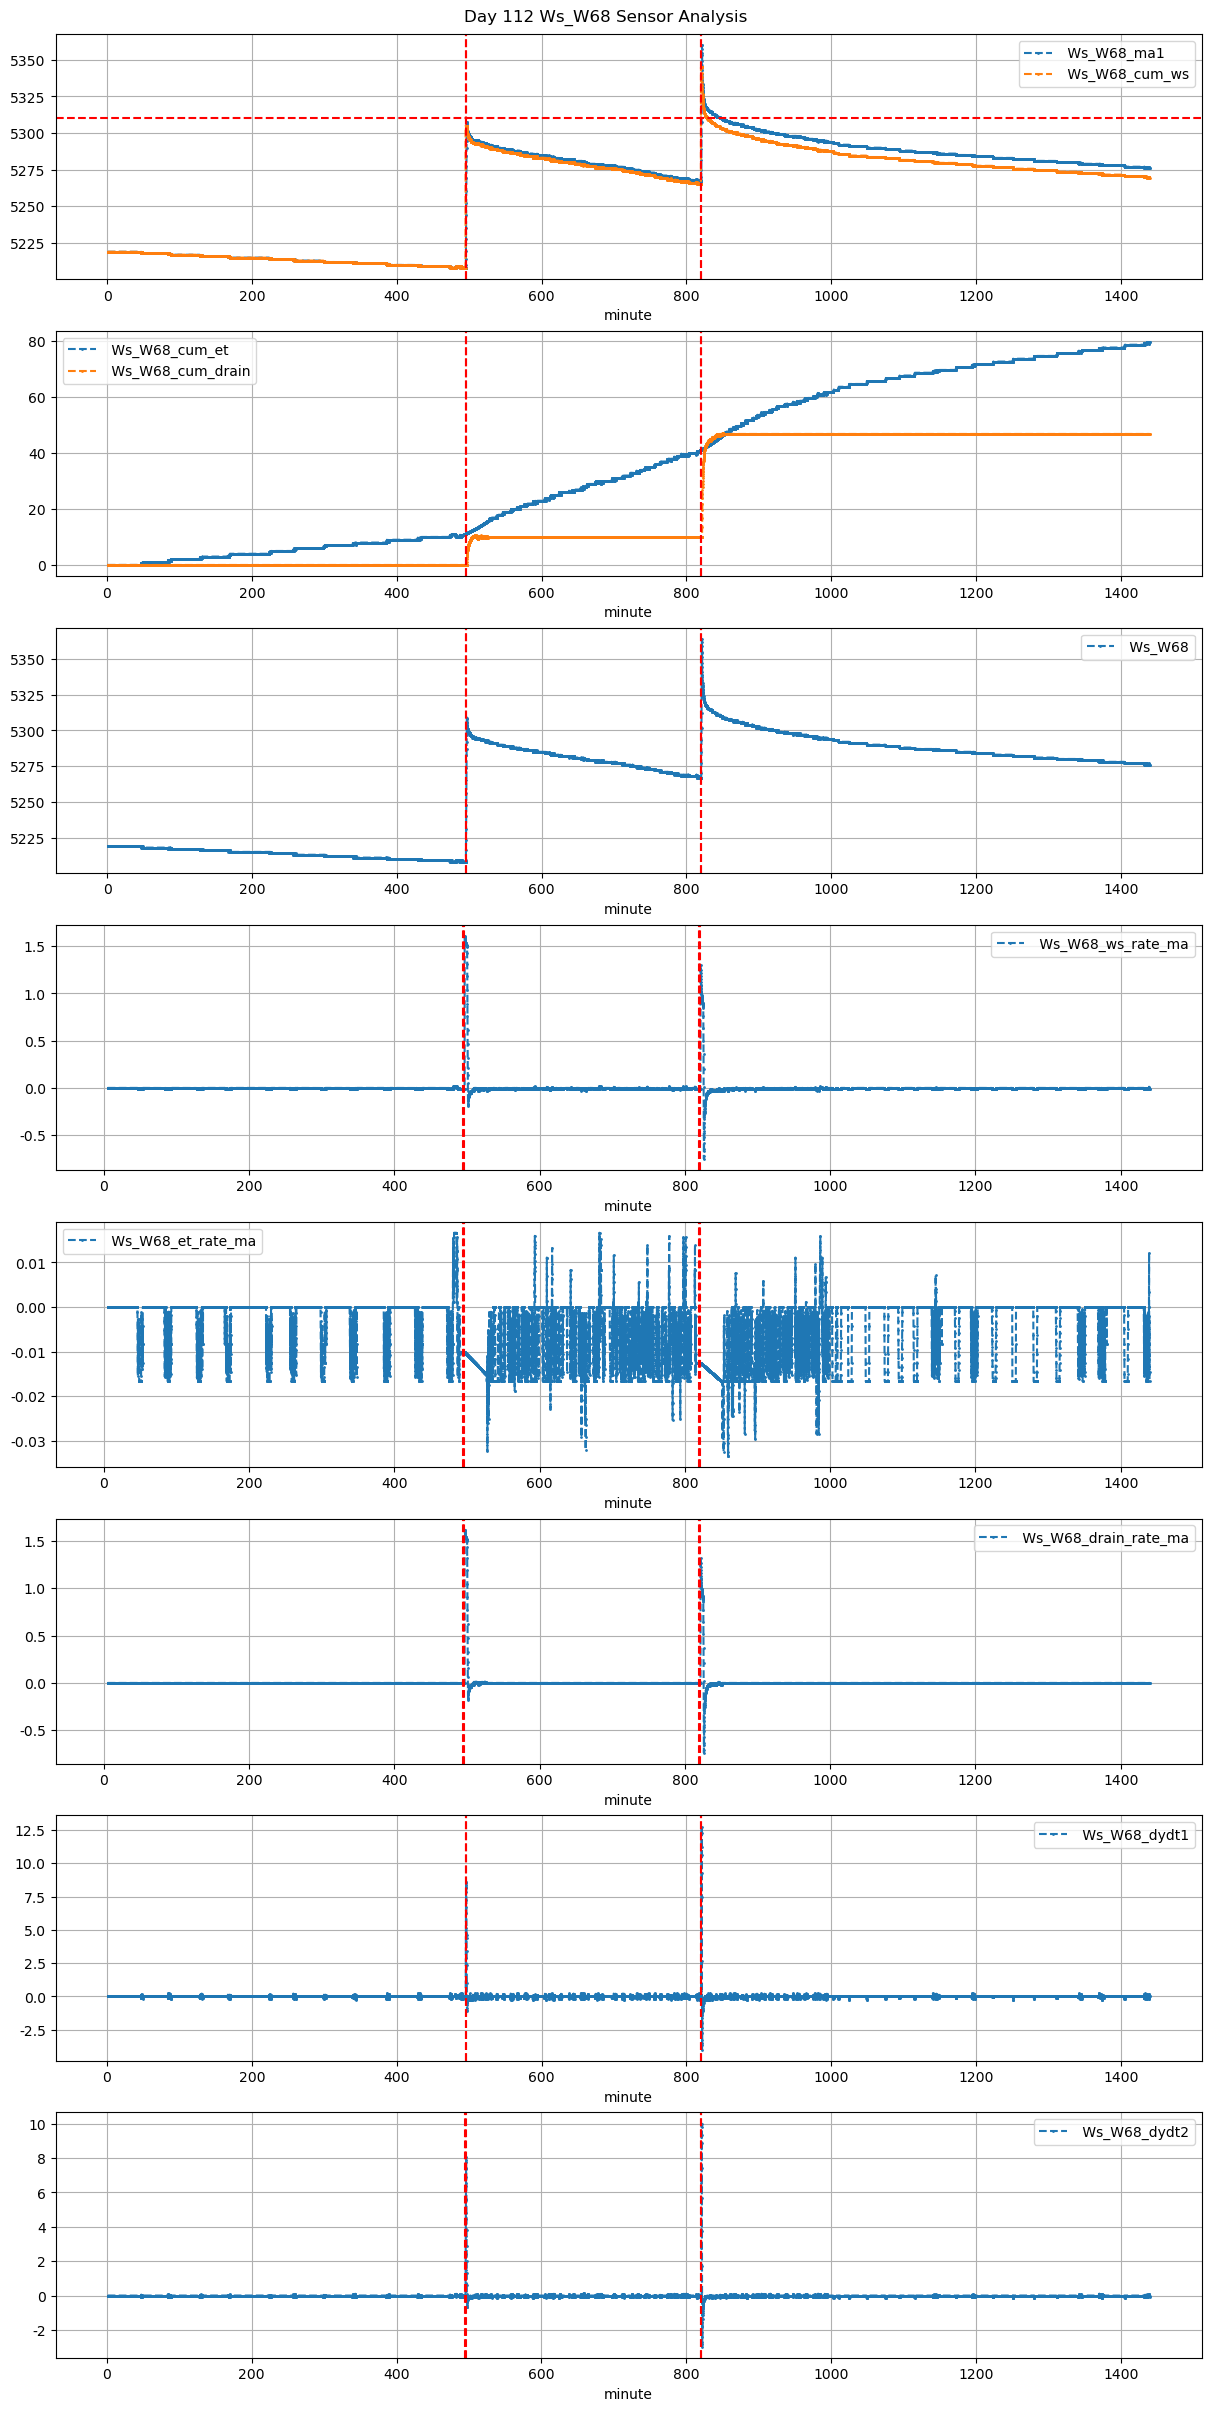
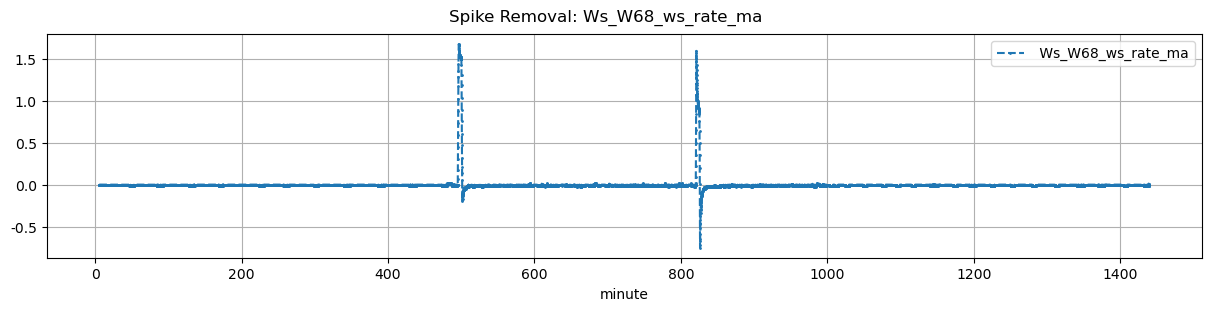
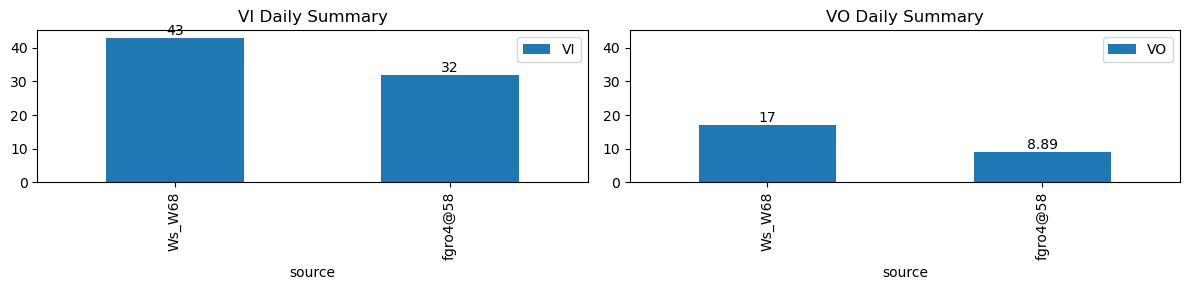
VI and VO Daily Summary
| ws_name | total_dp | nan_dp | nan_filled_dp | long_gap_dp | num_spike |
|---|---|---|---|---|---|
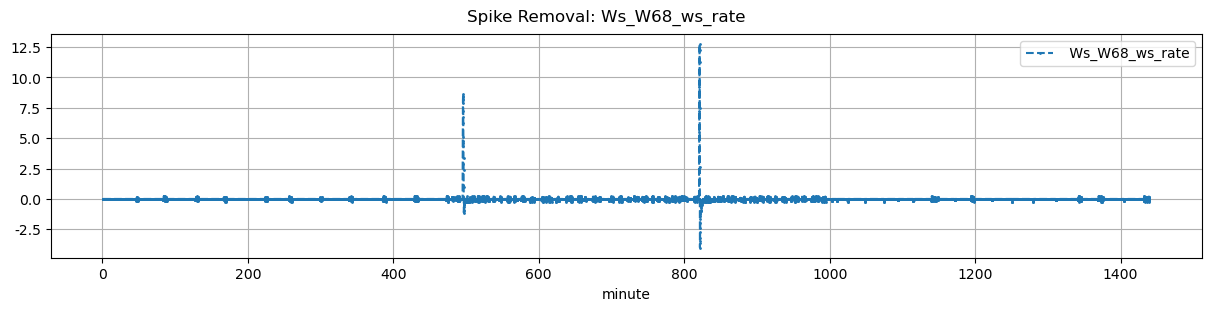
| Ws_W68 | 17269 | 0 | 14917 | 0 | 1 |
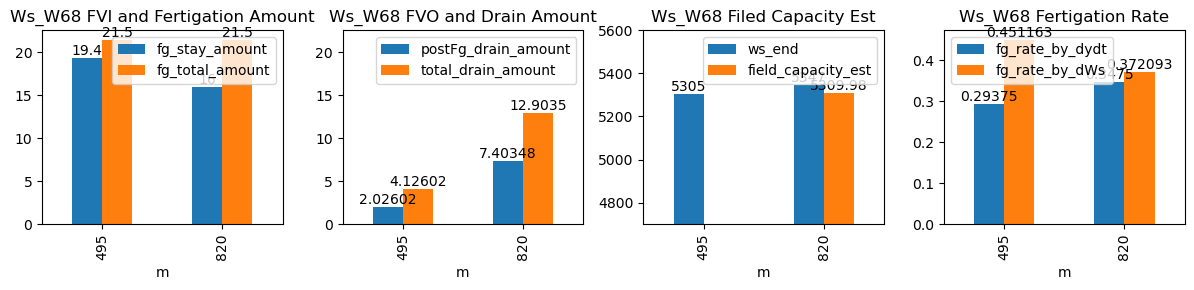
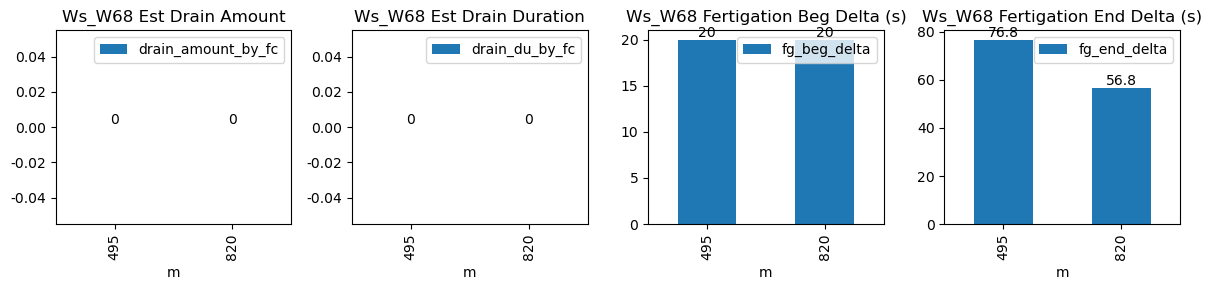
| ds | d | m | ws_name | prominence_cut | max_drain_du | fg_beg | fg_beg_est | fg_end | fg_end_est | drain_amount_by_fc | drain_du_by_fc | drain_rate_by_fc | ws_beg | ws_end | duc | pre_fg_et | post_fg_ws | post_drn_et | fg_rate_by_dydt | fg_rate_by_dWs | fg_stay_amount | fg_beg_delta | fg_end_delta | fg_total_amount | fg_drain_amount | postFg_drain_amount | field_capacity_est | total_drain_amount |
|---|---|---|---|---|---|---|---|---|---|---|---|---|---|---|---|---|---|---|---|---|---|---|---|---|---|---|---|---|
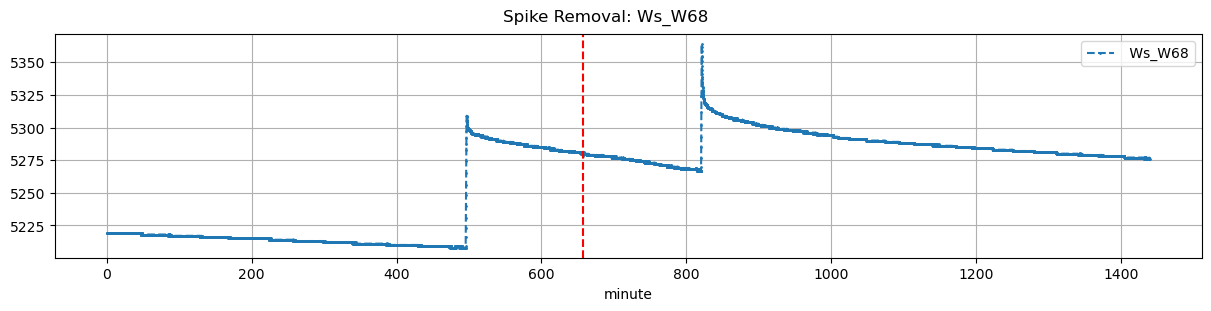
| 2026-01-26 08:15:00+08:00 | 112 | 495 | Ws_W68 | 0.693045 | 30 | 495.0 | 495.333333 | 495.72 | 497.000000 | NaN | NaN | NaN | 5208.0 | 5305.0 | 43 | -0.010134 | -0.05875 | -0.015139 | 0.29375 | 0.451163 | 19.4 | 20.0 | 76.8 | 21.5 | 2.1 | 2.026017 | NaN | 4.126017 |
| 2026-01-26 13:40:00+08:00 | 112 | 820 | Ws_W68 | 0.693045 | 30 | 820.0 | 820.333333 | 820.72 | 821.666667 | NaN | NaN | NaN | 5267.0 | 5347.0 | 43 | -0.012500 | -0.13750 | -0.016806 | 0.34750 | 0.372093 | 16.0 | 20.0 | 56.8 | 21.5 | 5.5 | 7.403480 | 5309.9826 | 12.903480 |