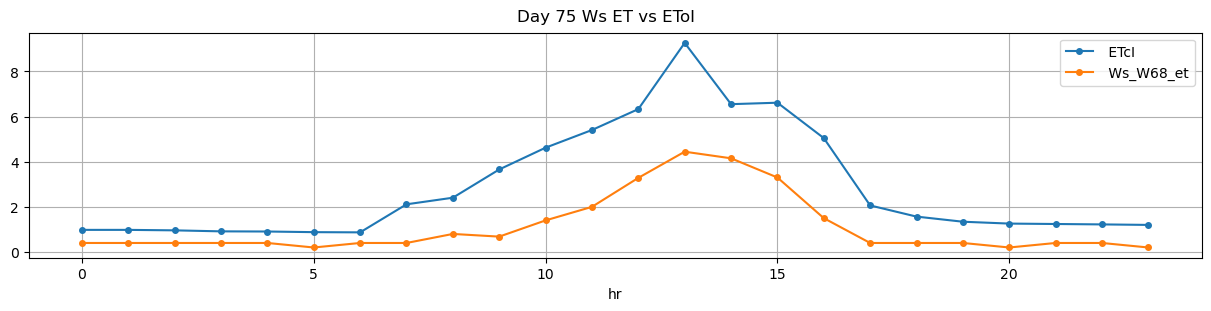
| 2025-12-20 09:05:00+08:00 |
75 |
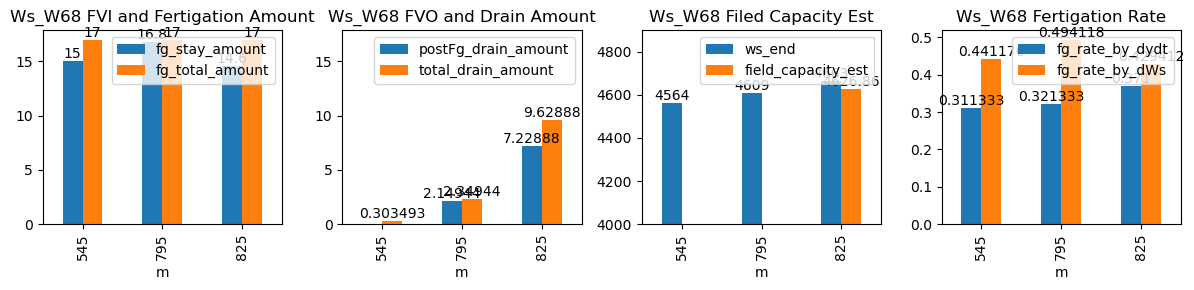
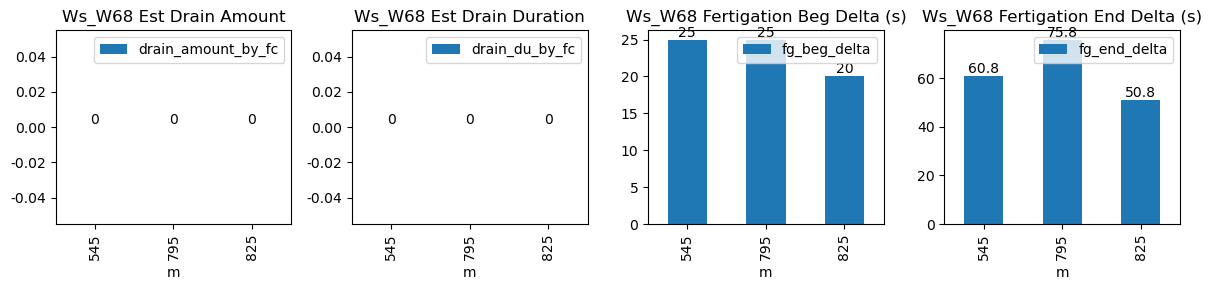
545 |
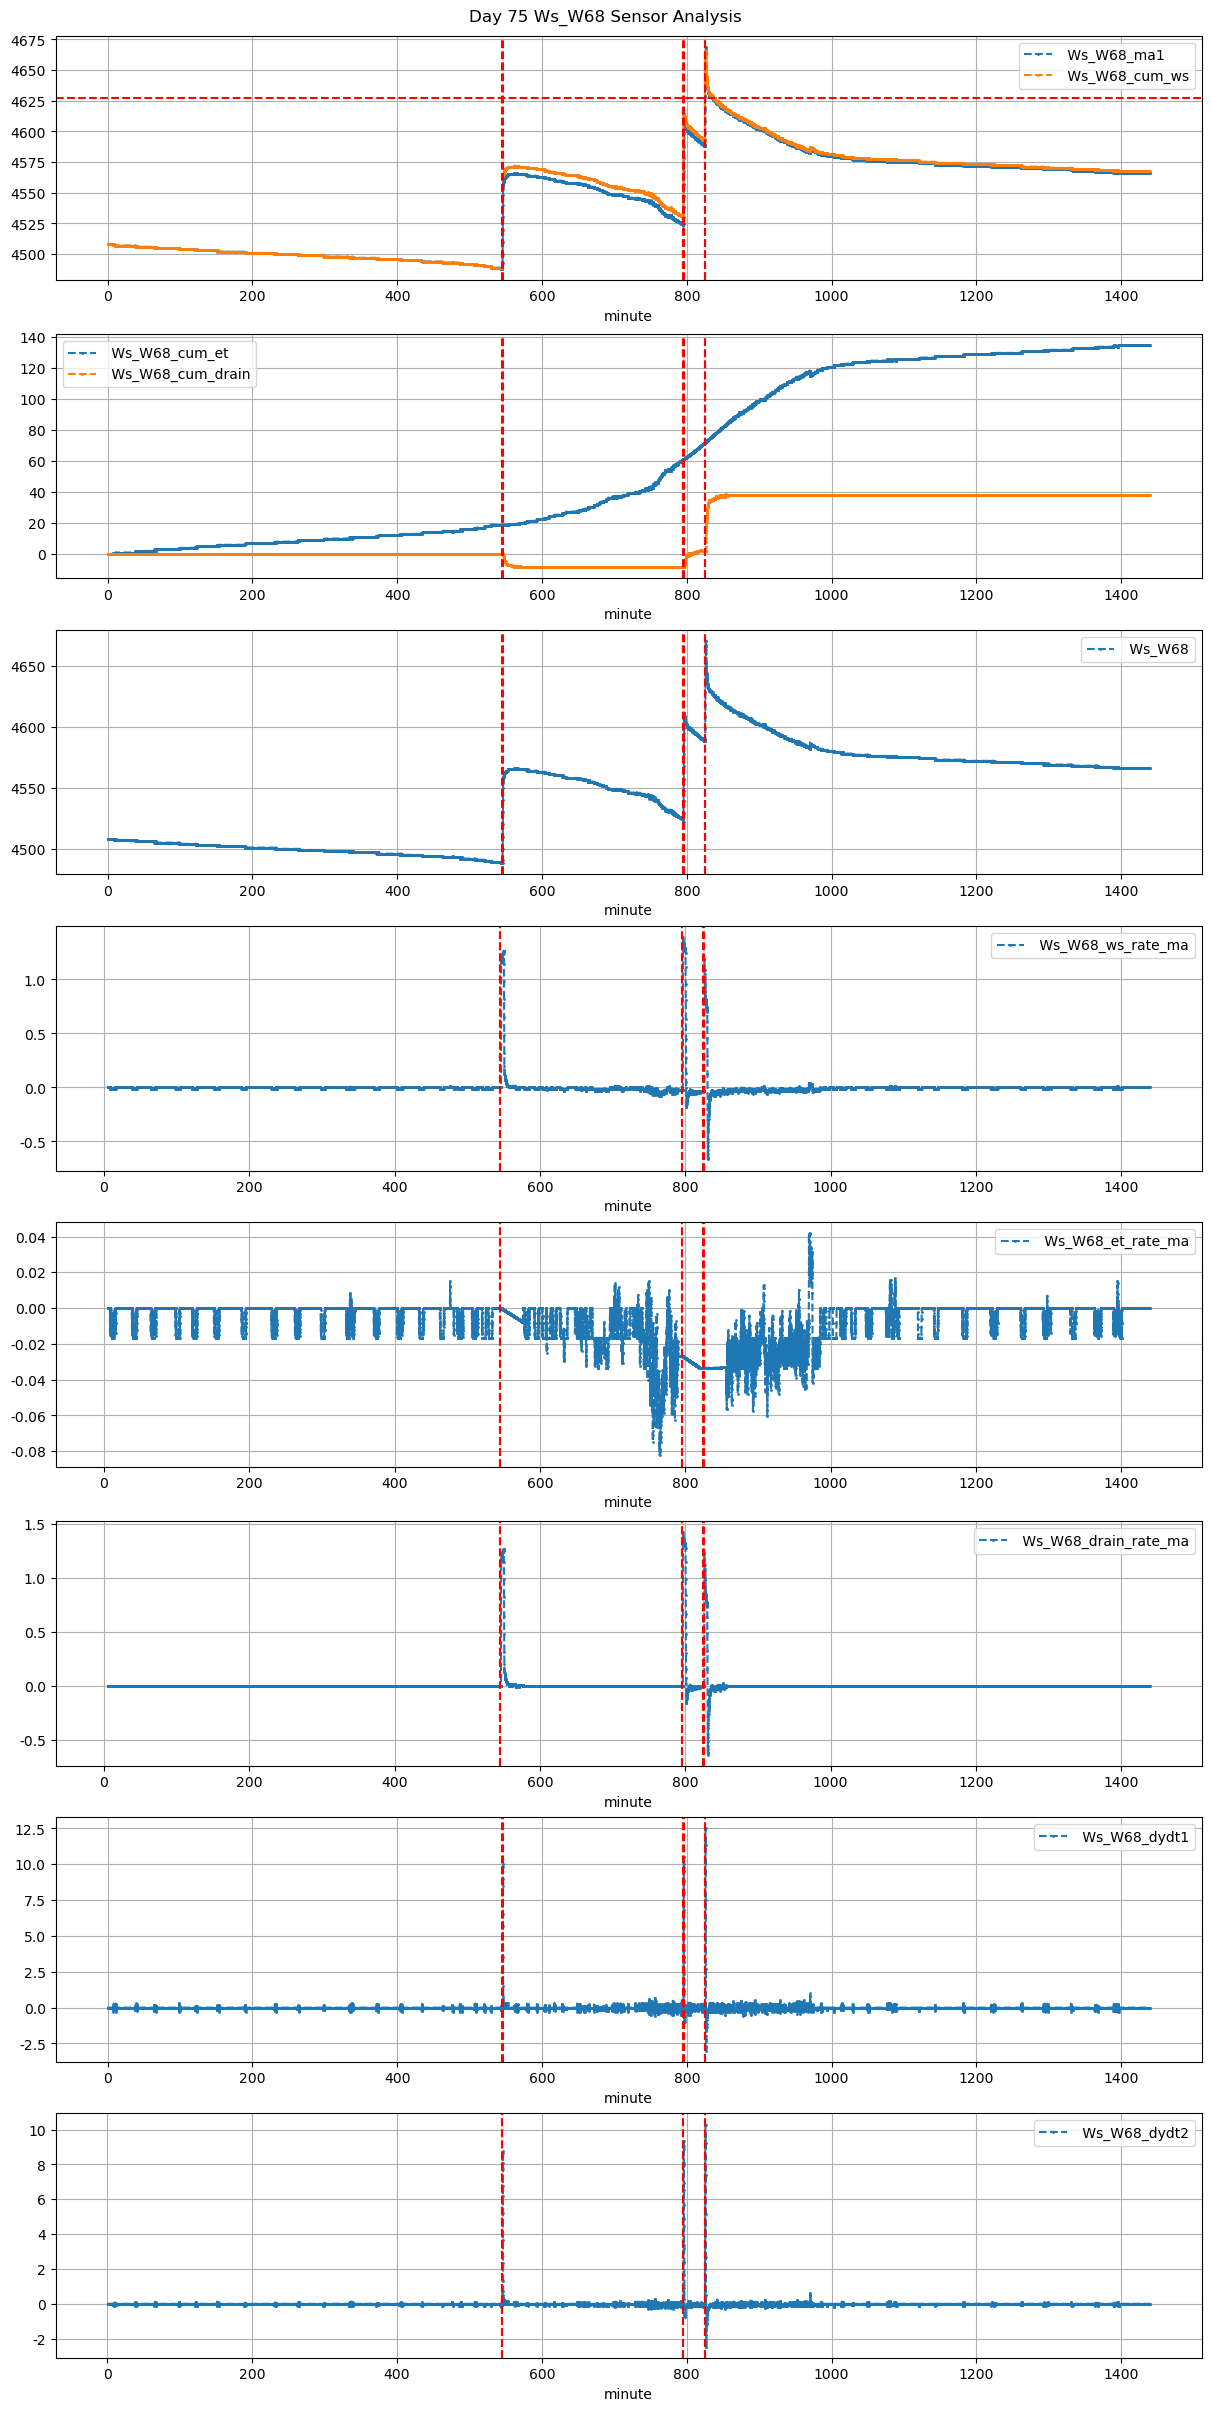
Ws_W68 |
0.621615 |
30.000000 |
545.0 |
545.416667 |
545.57 |
546.583333 |
NaN |
NaN |
NaN |
4489.0 |
4564.0 |
34 |
-0.006073 |
0.000000 |
-0.007778 |
0.311333 |
0.441176 |
15.0 |
25.0 |
60.8 |
17.0 |
2.0 |
-1.696507 |
NaN |
0.303493 |
| 2025-12-20 13:15:00+08:00 |
75 |
795 |
Ws_W68 |
0.621615 |
28.166667 |
795.0 |
795.416667 |
795.57 |
796.833333 |
NaN |
NaN |
NaN |
4525.0 |
4609.0 |
34 |
-0.027048 |
-0.066806 |
0.000000 |
0.321333 |
0.494118 |
16.8 |
25.0 |
75.8 |
17.0 |
0.2 |
2.149435 |
NaN |
2.349435 |
| 2025-12-20 13:45:00+08:00 |
75 |
825 |
Ws_W68 |
0.621615 |
30.000000 |
825.0 |
825.333333 |
825.57 |
826.416667 |
NaN |
NaN |
NaN |
4590.0 |
4663.0 |
34 |
-0.033404 |
-0.157639 |
-0.033194 |
0.371000 |
0.429412 |
14.6 |
20.0 |
50.8 |
17.0 |
2.4 |
7.228880 |
4626.855602 |
9.628880 |