| 2025-12-21 11:35:00+08:00 |
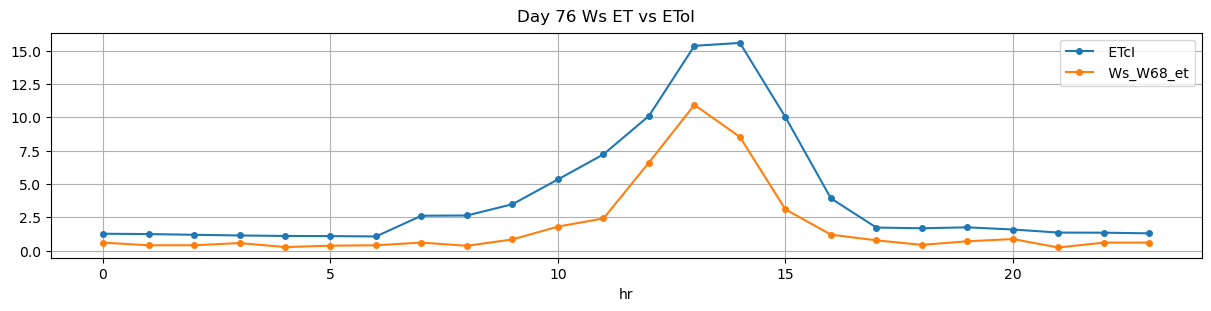
76 |
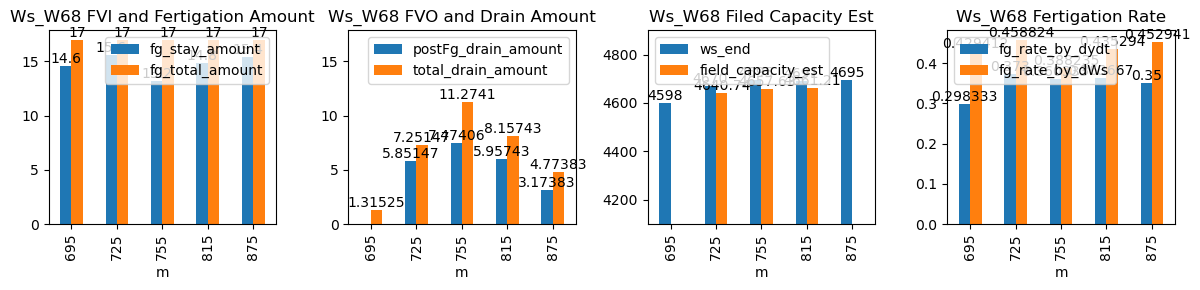
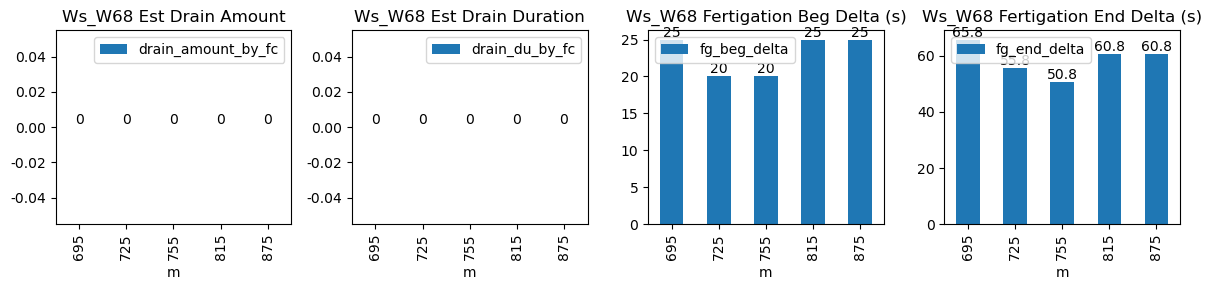
695 |
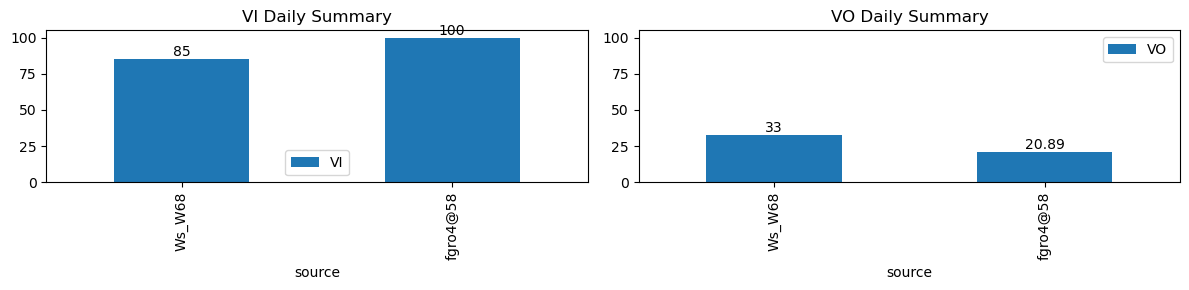
Ws_W68 |
0.808601 |
28.333333 |
695.0 |
695.416667 |
695.57 |
696.666667 |
NaN |
NaN |
NaN |
4525.0 |
4598.0 |
34 |
-0.015119 |
0.000000 |
0.000000 |
0.298333 |
0.429412 |
14.6 |
25.0 |
65.8 |
17.0 |
2.4 |
-1.084746 |
NaN |
1.315254 |
| 2025-12-21 12:05:00+08:00 |
76 |
725 |
Ws_W68 |
0.808601 |
28.500000 |
725.0 |
725.333333 |
725.57 |
726.500000 |
NaN |
NaN |
NaN |
4592.0 |
4670.0 |
34 |
-0.035169 |
-0.156389 |
0.000000 |
0.373000 |
0.458824 |
15.6 |
20.0 |
55.8 |
17.0 |
1.4 |
5.851469 |
4640.742655 |
7.251469 |
| 2025-12-21 12:35:00+08:00 |
76 |
755 |
Ws_W68 |
0.808601 |
30.000000 |
755.0 |
755.333333 |
755.57 |
756.416667 |
NaN |
NaN |
NaN |
4629.0 |
4695.0 |
34 |
-0.049294 |
-0.163750 |
-0.054779 |
0.360333 |
0.388235 |
13.2 |
20.0 |
50.8 |
17.0 |
3.8 |
7.474058 |
4657.629708 |
11.274058 |
| 2025-12-21 13:35:00+08:00 |
76 |
815 |
Ws_W68 |
0.808601 |
30.000000 |
815.0 |
815.416667 |
815.57 |
816.583333 |
NaN |
NaN |
NaN |
4617.0 |
4691.0 |
34 |
-0.073905 |
-0.148194 |
-0.073333 |
0.363667 |
0.435294 |
14.8 |
25.0 |
60.8 |
17.0 |
2.2 |
5.957428 |
4661.212862 |
8.157428 |
| 2025-12-21 14:35:00+08:00 |
76 |
875 |
Ws_W68 |
0.808601 |
30.000000 |
875.0 |
875.416667 |
875.57 |
876.583333 |
NaN |
NaN |
NaN |
4618.0 |
4695.0 |
34 |
-0.063701 |
-0.094444 |
-0.034537 |
0.350000 |
0.452941 |
15.4 |
25.0 |
60.8 |
17.0 |
1.6 |
3.173828 |
NaN |
4.773828 |