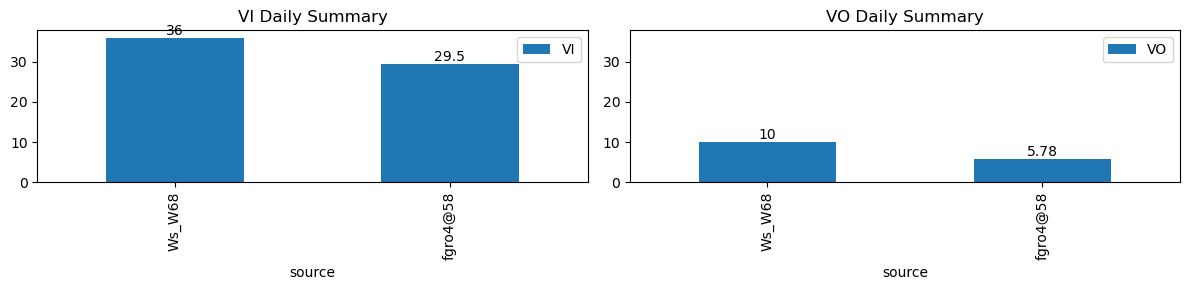
VI and VO Daily Summary
| ws_name | total_dp | nan_dp | nan_filled_dp | long_gap_dp | num_spike |
|---|---|---|---|---|---|
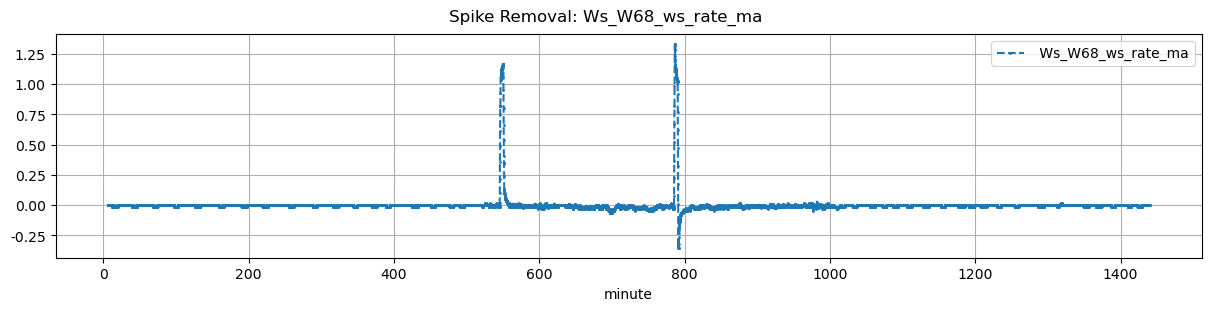
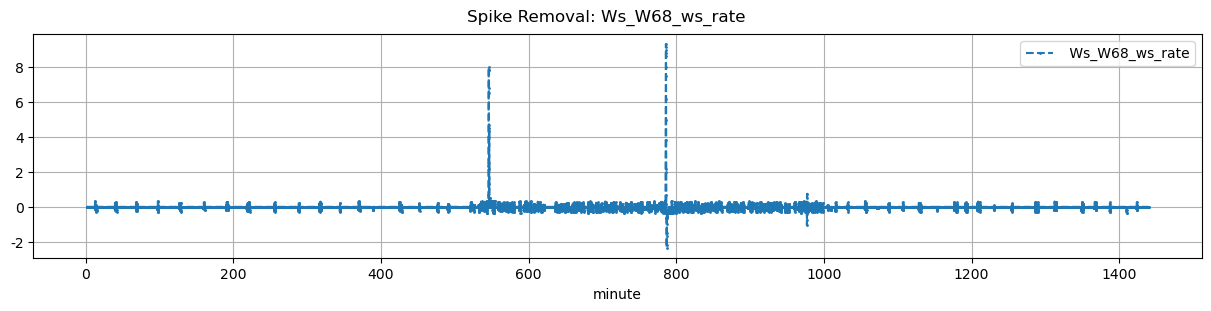
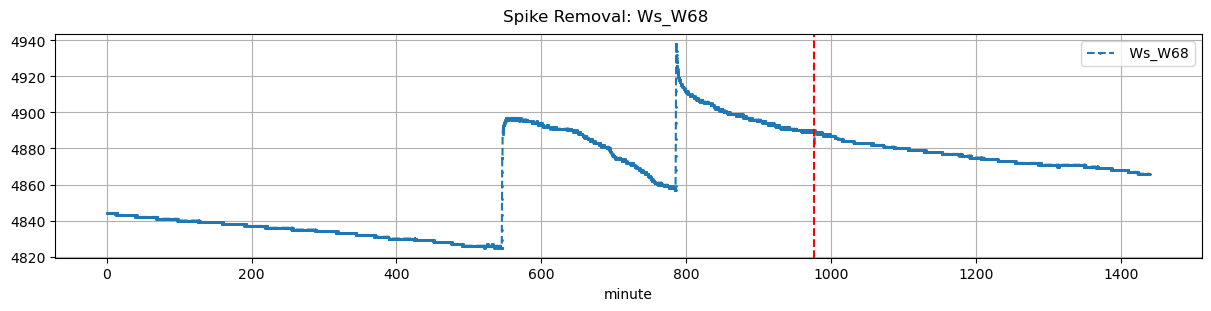
| Ws_W68 | 17269 | 0 | 14821 | 0 | 1 |
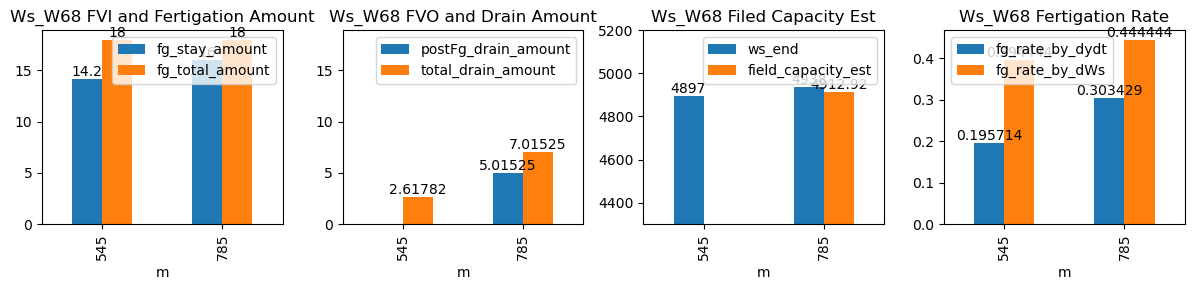
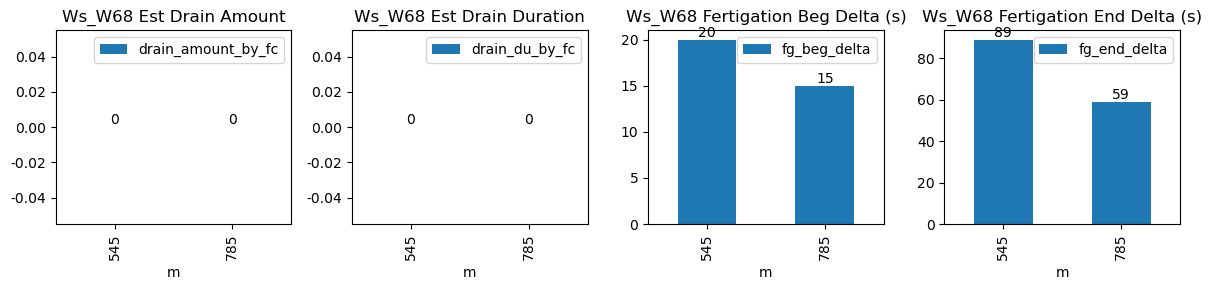
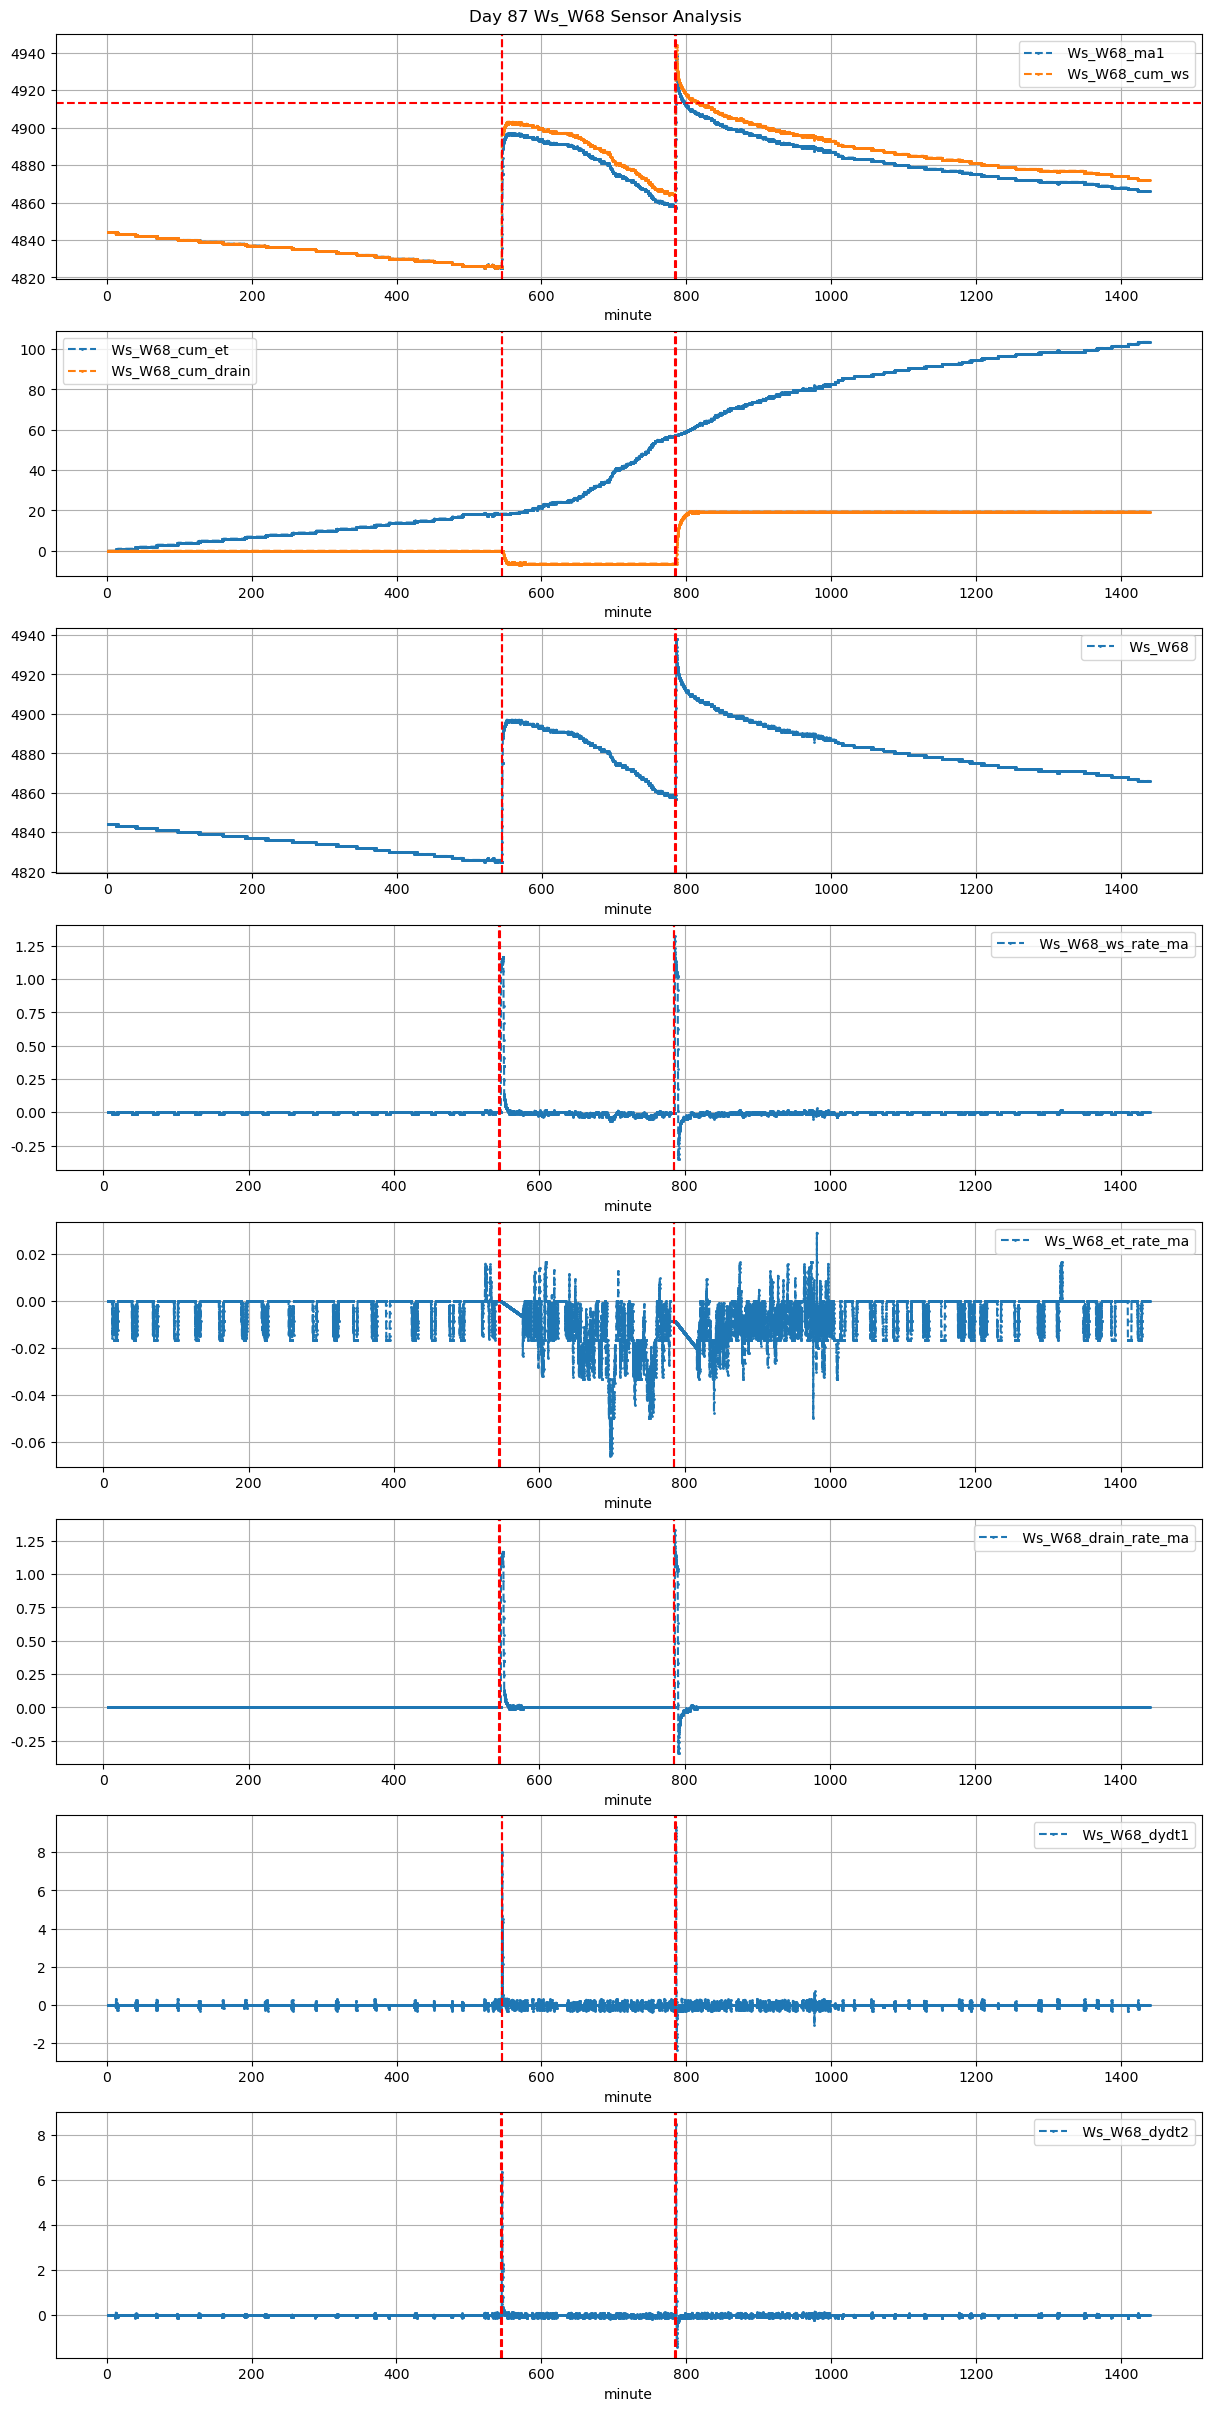
| ds | d | m | ws_name | prominence_cut | max_drain_du | fg_beg | fg_beg_est | fg_end | fg_end_est | drain_amount_by_fc | drain_du_by_fc | drain_rate_by_fc | ws_beg | ws_end | duc | pre_fg_et | post_fg_ws | post_drn_et | fg_rate_by_dydt | fg_rate_by_dWs | fg_stay_amount | fg_beg_delta | fg_end_delta | fg_total_amount | fg_drain_amount | postFg_drain_amount | field_capacity_est | total_drain_amount |
|---|---|---|---|---|---|---|---|---|---|---|---|---|---|---|---|---|---|---|---|---|---|---|---|---|---|---|---|---|
| 2026-01-01 09:05:00+08:00 | 87 | 545 | Ws_W68 | 0.339771 | 30 | 545.0 | 545.333333 | 545.6 | 547.083333 | NaN | NaN | NaN | 4826.0 | 4897.0 | 36 | -0.002055 | 0.00 | -0.006556 | 0.195714 | 0.394444 | 14.2 | 20.0 | 89.0 | 18.0 | 3.8 | -1.182183 | NaN | 2.617817 |
| 2026-01-01 13:05:00+08:00 | 87 | 785 | Ws_W68 | 0.339771 | 30 | 785.0 | 785.250000 | 785.6 | 786.583333 | NaN | NaN | NaN | 4858.0 | 4938.0 | 36 | -0.008427 | -0.12 | -0.020193 | 0.303429 | 0.444444 | 16.0 | 15.0 | 59.0 | 18.0 | 2.0 | 5.015249 | 4912.923757 | 7.015249 |