| 2026-01-02 10:25:00+08:00 |
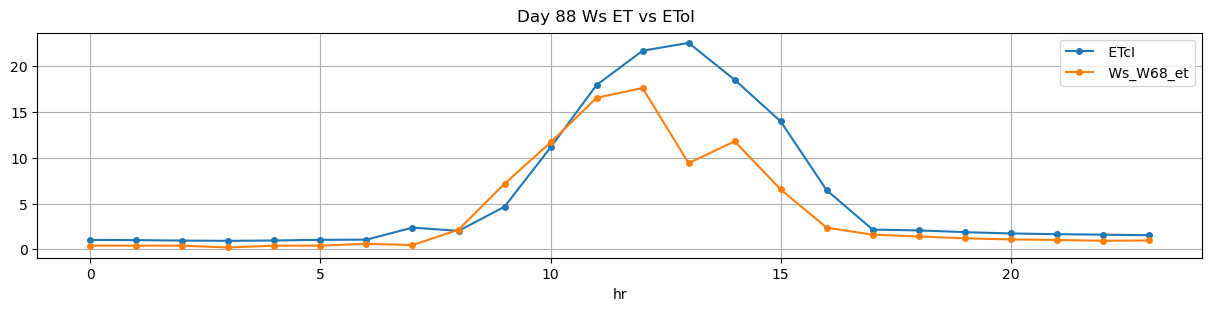
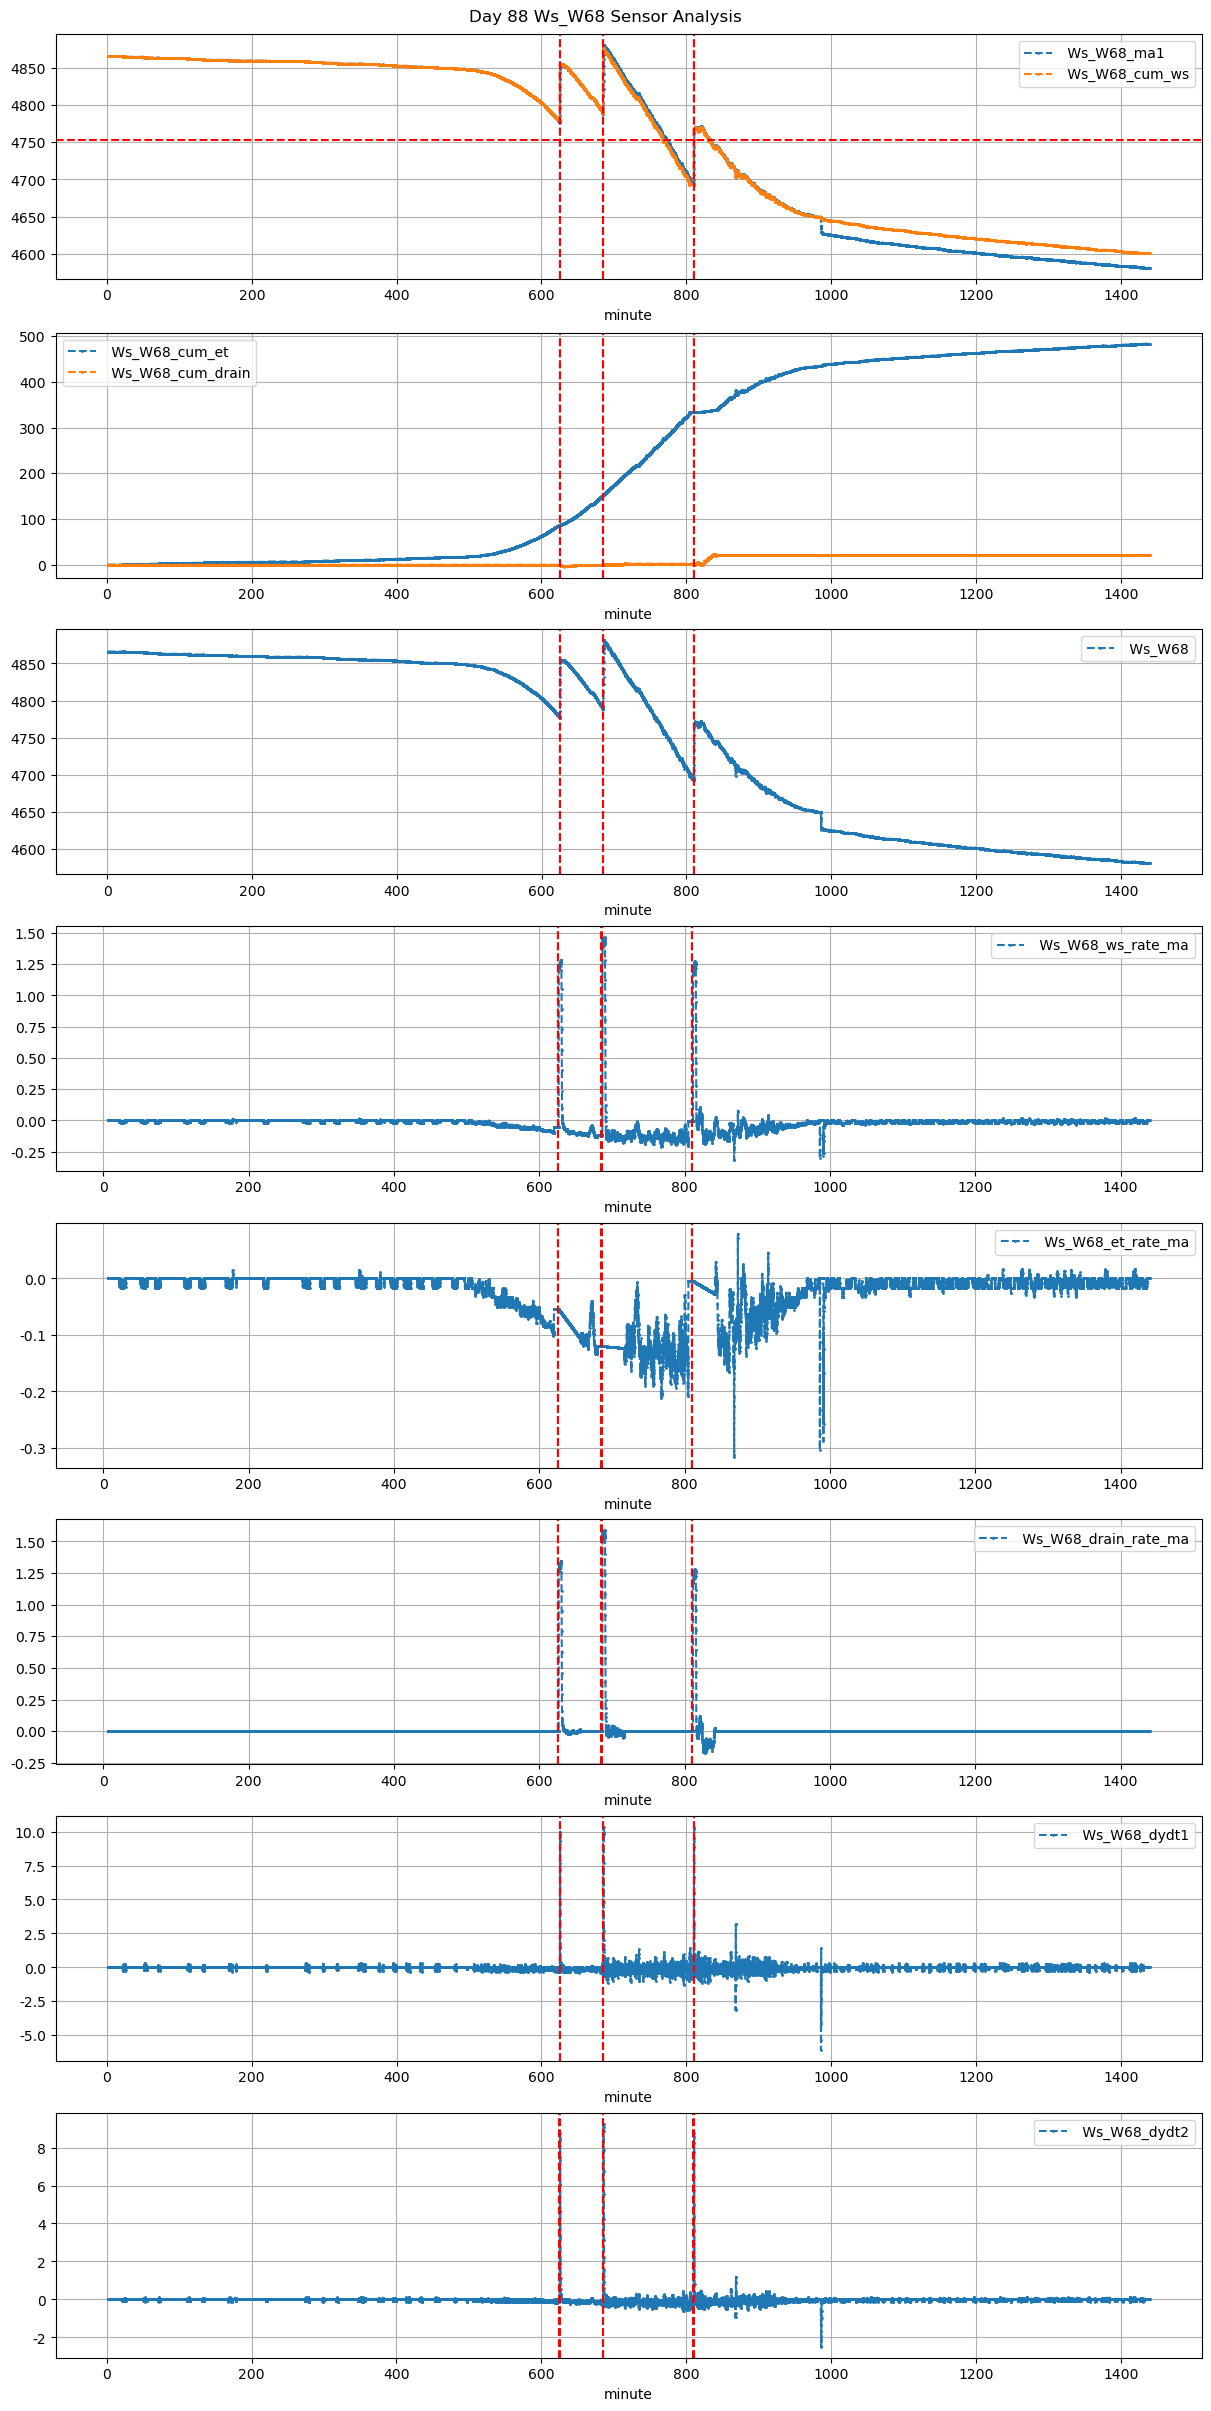
88 |
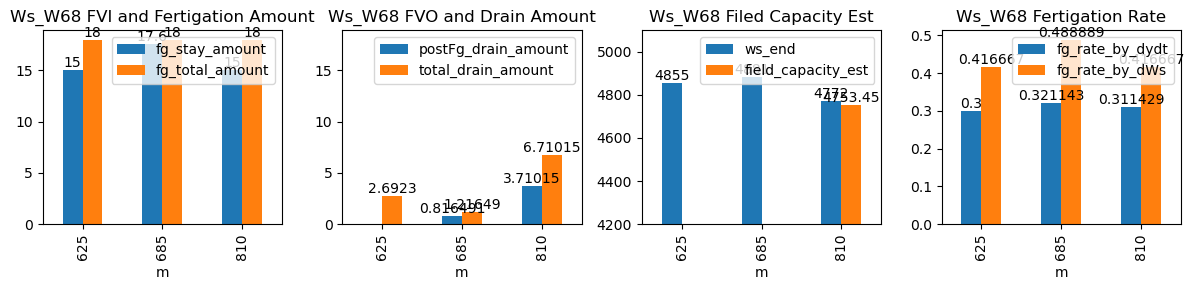
625 |
Ws_W68 |
0.565658 |
30 |
625.0 |
625.333333 |
625.6 |
626.583333 |
NaN |
NaN |
NaN |
4780.0 |
4855.0 |
36 |
-0.089306 |
-0.054722 |
-0.106944 |
0.300000 |
0.416667 |
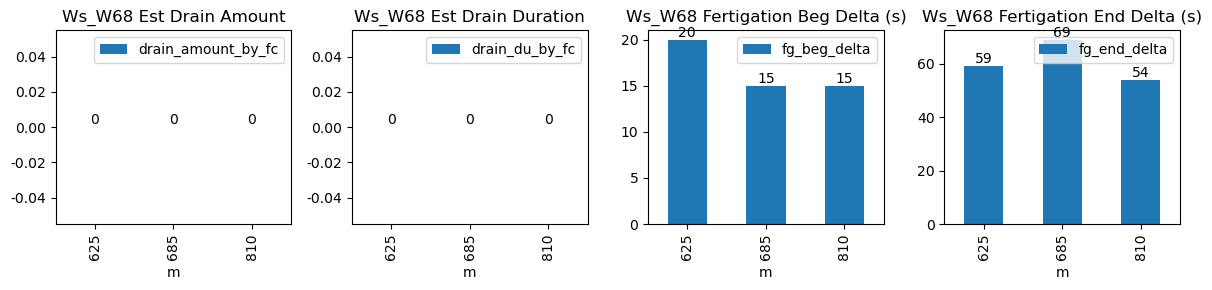
15.0 |
20.0 |
59.0 |
18.0 |
3.0 |
-0.307702 |
NaN |
2.692298 |
| 2026-01-02 11:25:00+08:00 |
88 |
685 |
Ws_W68 |
0.565658 |
30 |
685.0 |
685.250000 |
685.6 |
686.750000 |
NaN |
NaN |
NaN |
4793.0 |
4881.0 |
36 |
-0.119676 |
-0.120694 |
-0.123264 |
0.321143 |
0.488889 |
17.6 |
15.0 |
69.0 |
18.0 |
0.4 |
0.816491 |
NaN |
1.216491 |
| 2026-01-02 13:30:00+08:00 |
88 |
810 |
Ws_W68 |
0.565658 |
30 |
810.0 |
810.250000 |
810.6 |
811.500000 |
NaN |
NaN |
NaN |
4697.0 |
4772.0 |
36 |
-0.125847 |
-0.004583 |
-0.027188 |
0.311429 |
0.416667 |
15.0 |
15.0 |
54.0 |
18.0 |
3.0 |
3.710153 |
4753.449234 |
6.710153 |