| 2025-12-31 09:00:00+08:00 |
86 |
540 |
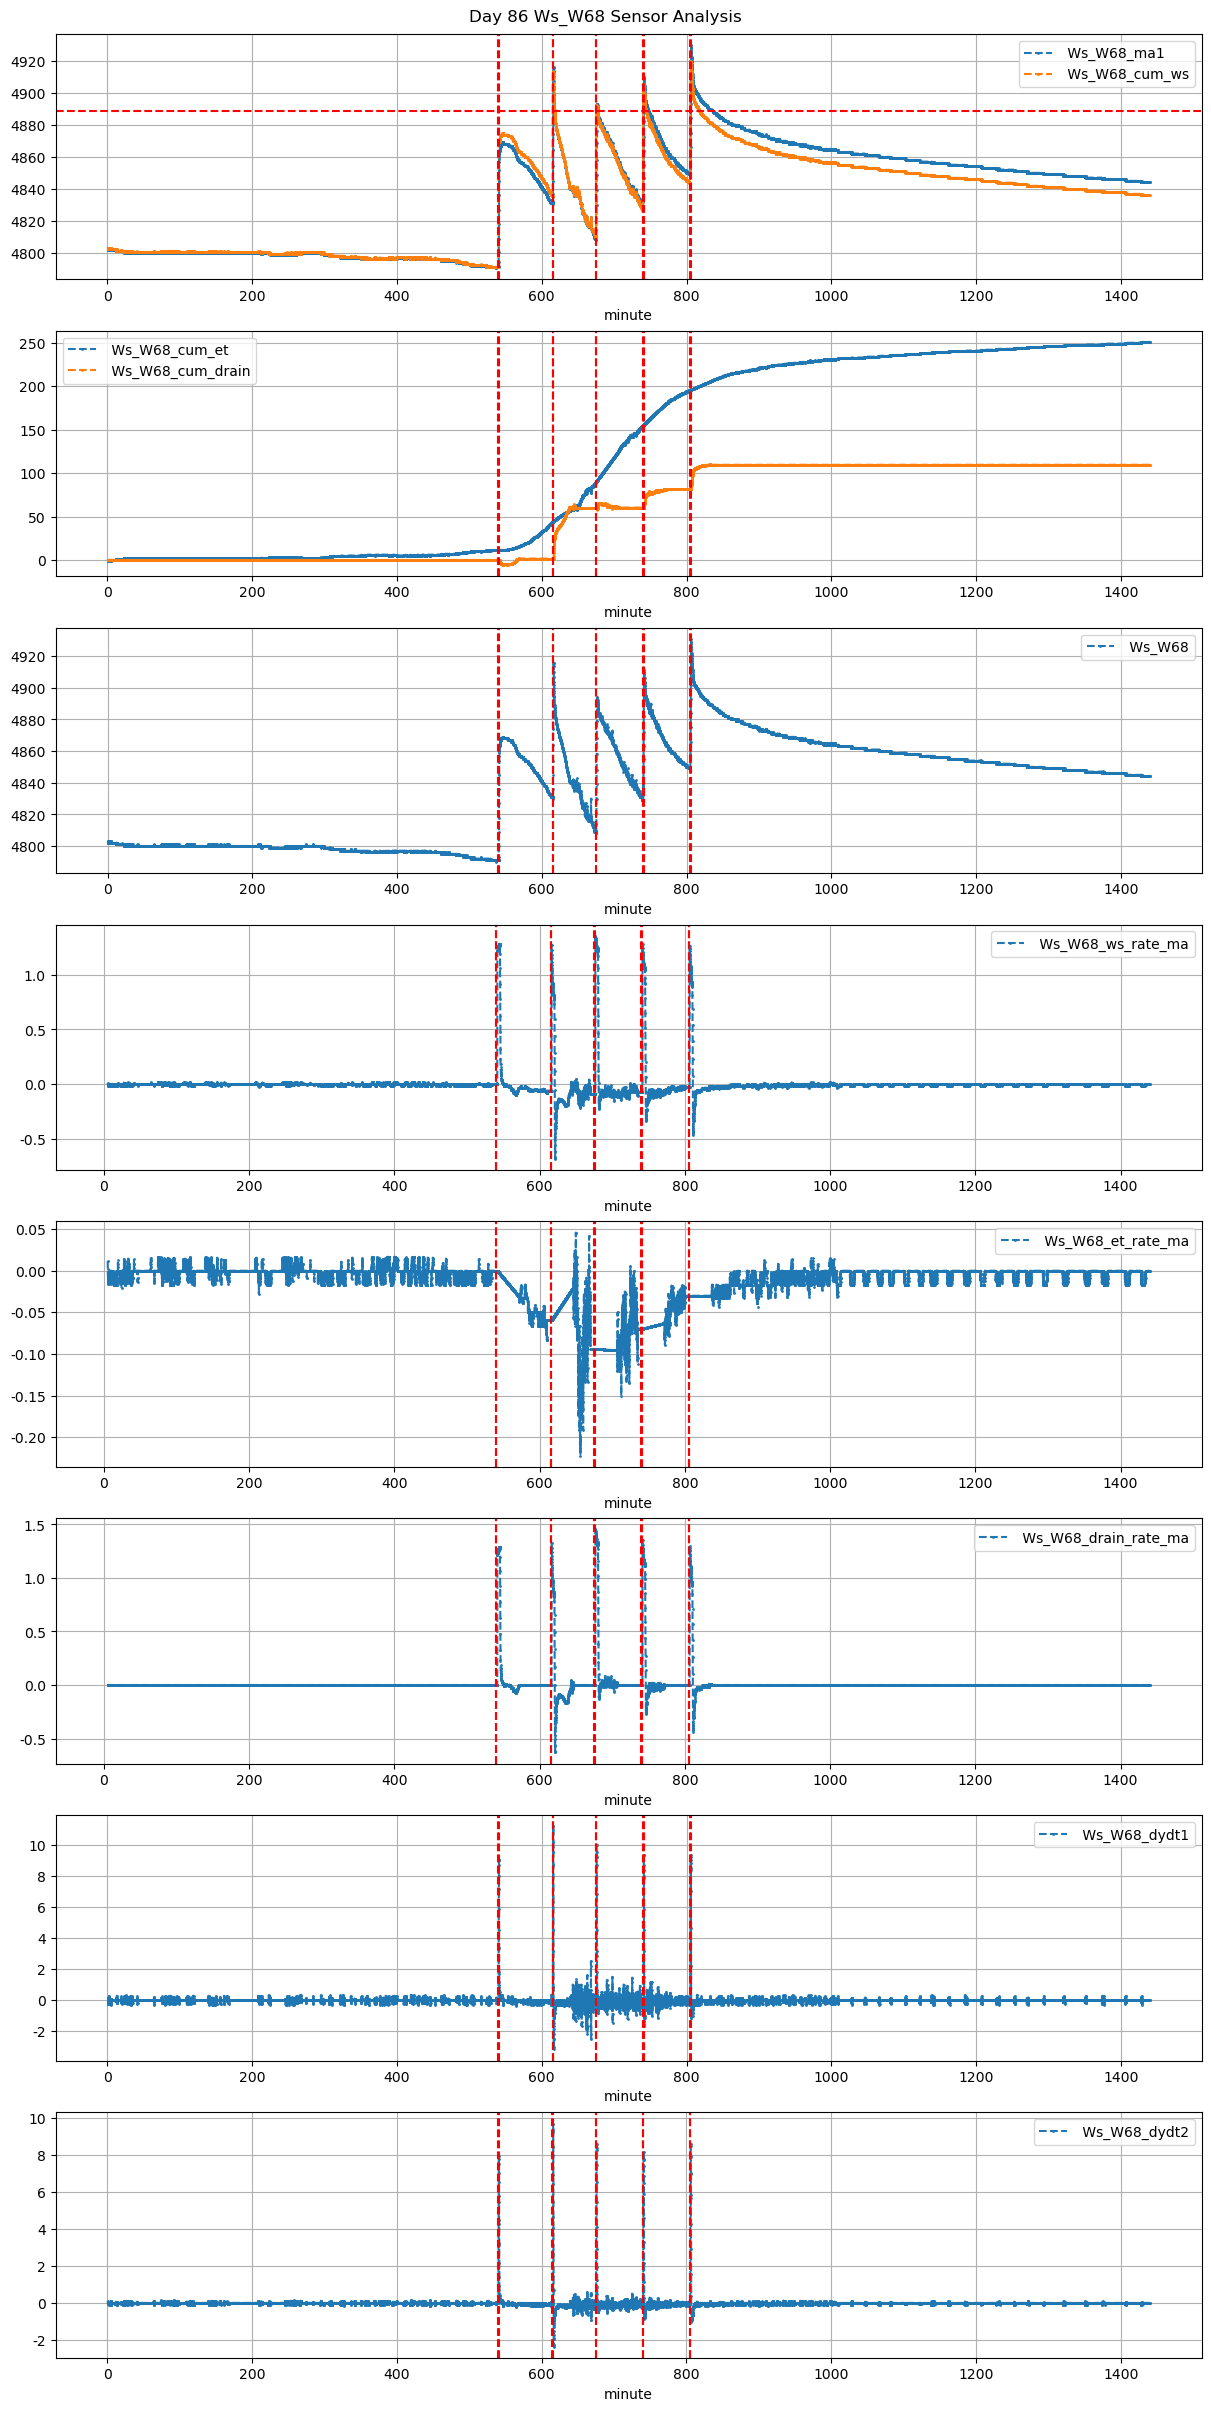
Ws_W68 |
0.431419 |
30 |
540.0 |
540.333333 |
540.6 |
541.750000 |
NaN |
NaN |
NaN |
4791.0 |
4869.0 |
36 |
-0.000282 |
0.000000 |
-0.031354 |
0.272571 |
0.433333 |
15.6 |
20.0 |
69.0 |
18.0 |
2.4 |
0.245145 |
NaN |
2.645145 |
| 2025-12-31 10:15:00+08:00 |
86 |
615 |
Ws_W68 |
0.431419 |
30 |
615.0 |
615.333333 |
615.6 |
616.500000 |
NaN |
NaN |
NaN |
4832.0 |
4910.0 |
36 |
-0.059463 |
-0.235000 |
-0.019769 |
0.342286 |
0.433333 |
15.6 |
20.0 |
54.0 |
18.0 |
2.4 |
11.684228 |
4851.578858 |
14.084228 |
| 2025-12-31 11:15:00+08:00 |
86 |
675 |
Ws_W68 |
0.431419 |
30 |
675.0 |
675.333333 |
675.6 |
676.750000 |
NaN |
NaN |
NaN |
4811.0 |
4894.0 |
36 |
-0.094005 |
-0.103194 |
-0.095731 |
0.302000 |
0.461111 |
16.6 |
20.0 |
69.0 |
18.0 |
1.4 |
0.399167 |
NaN |
1.799167 |
| 2025-12-31 12:20:00+08:00 |
86 |
740 |
Ws_W68 |
0.431419 |
30 |
740.0 |
740.166667 |
740.6 |
741.666667 |
NaN |
NaN |
NaN |
4831.0 |
4910.0 |
36 |
-0.069761 |
-0.149861 |
-0.063089 |
0.282857 |
0.438889 |
15.8 |
10.0 |
64.0 |
18.0 |
2.2 |
4.295335 |
4888.523324 |
6.495335 |
| 2025-12-31 13:25:00+08:00 |
86 |
805 |
Ws_W68 |
0.431419 |
30 |
805.0 |
805.250000 |
805.6 |
806.583333 |
NaN |
NaN |
NaN |
4850.0 |
4926.0 |
36 |
-0.030155 |
-0.162500 |
-0.030015 |
0.308857 |
0.422222 |
15.2 |
15.0 |
59.0 |
18.0 |
2.8 |
5.527220 |
4898.363902 |
8.327220 |