| 2026-01-05 11:10:00+08:00 |
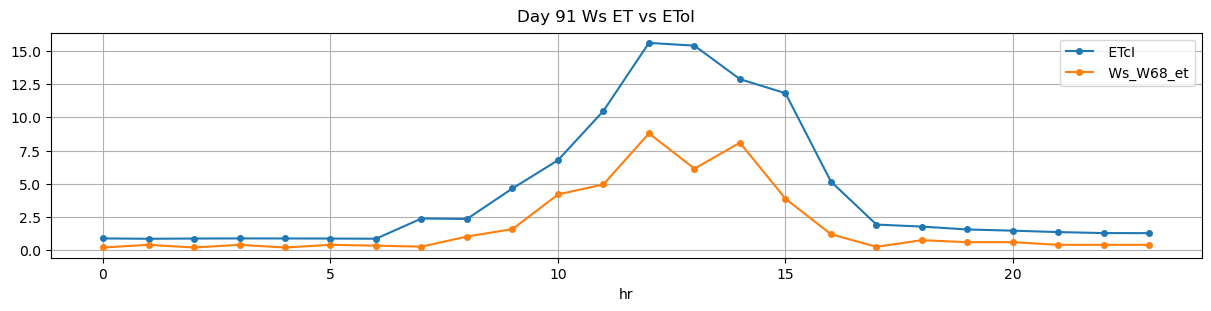
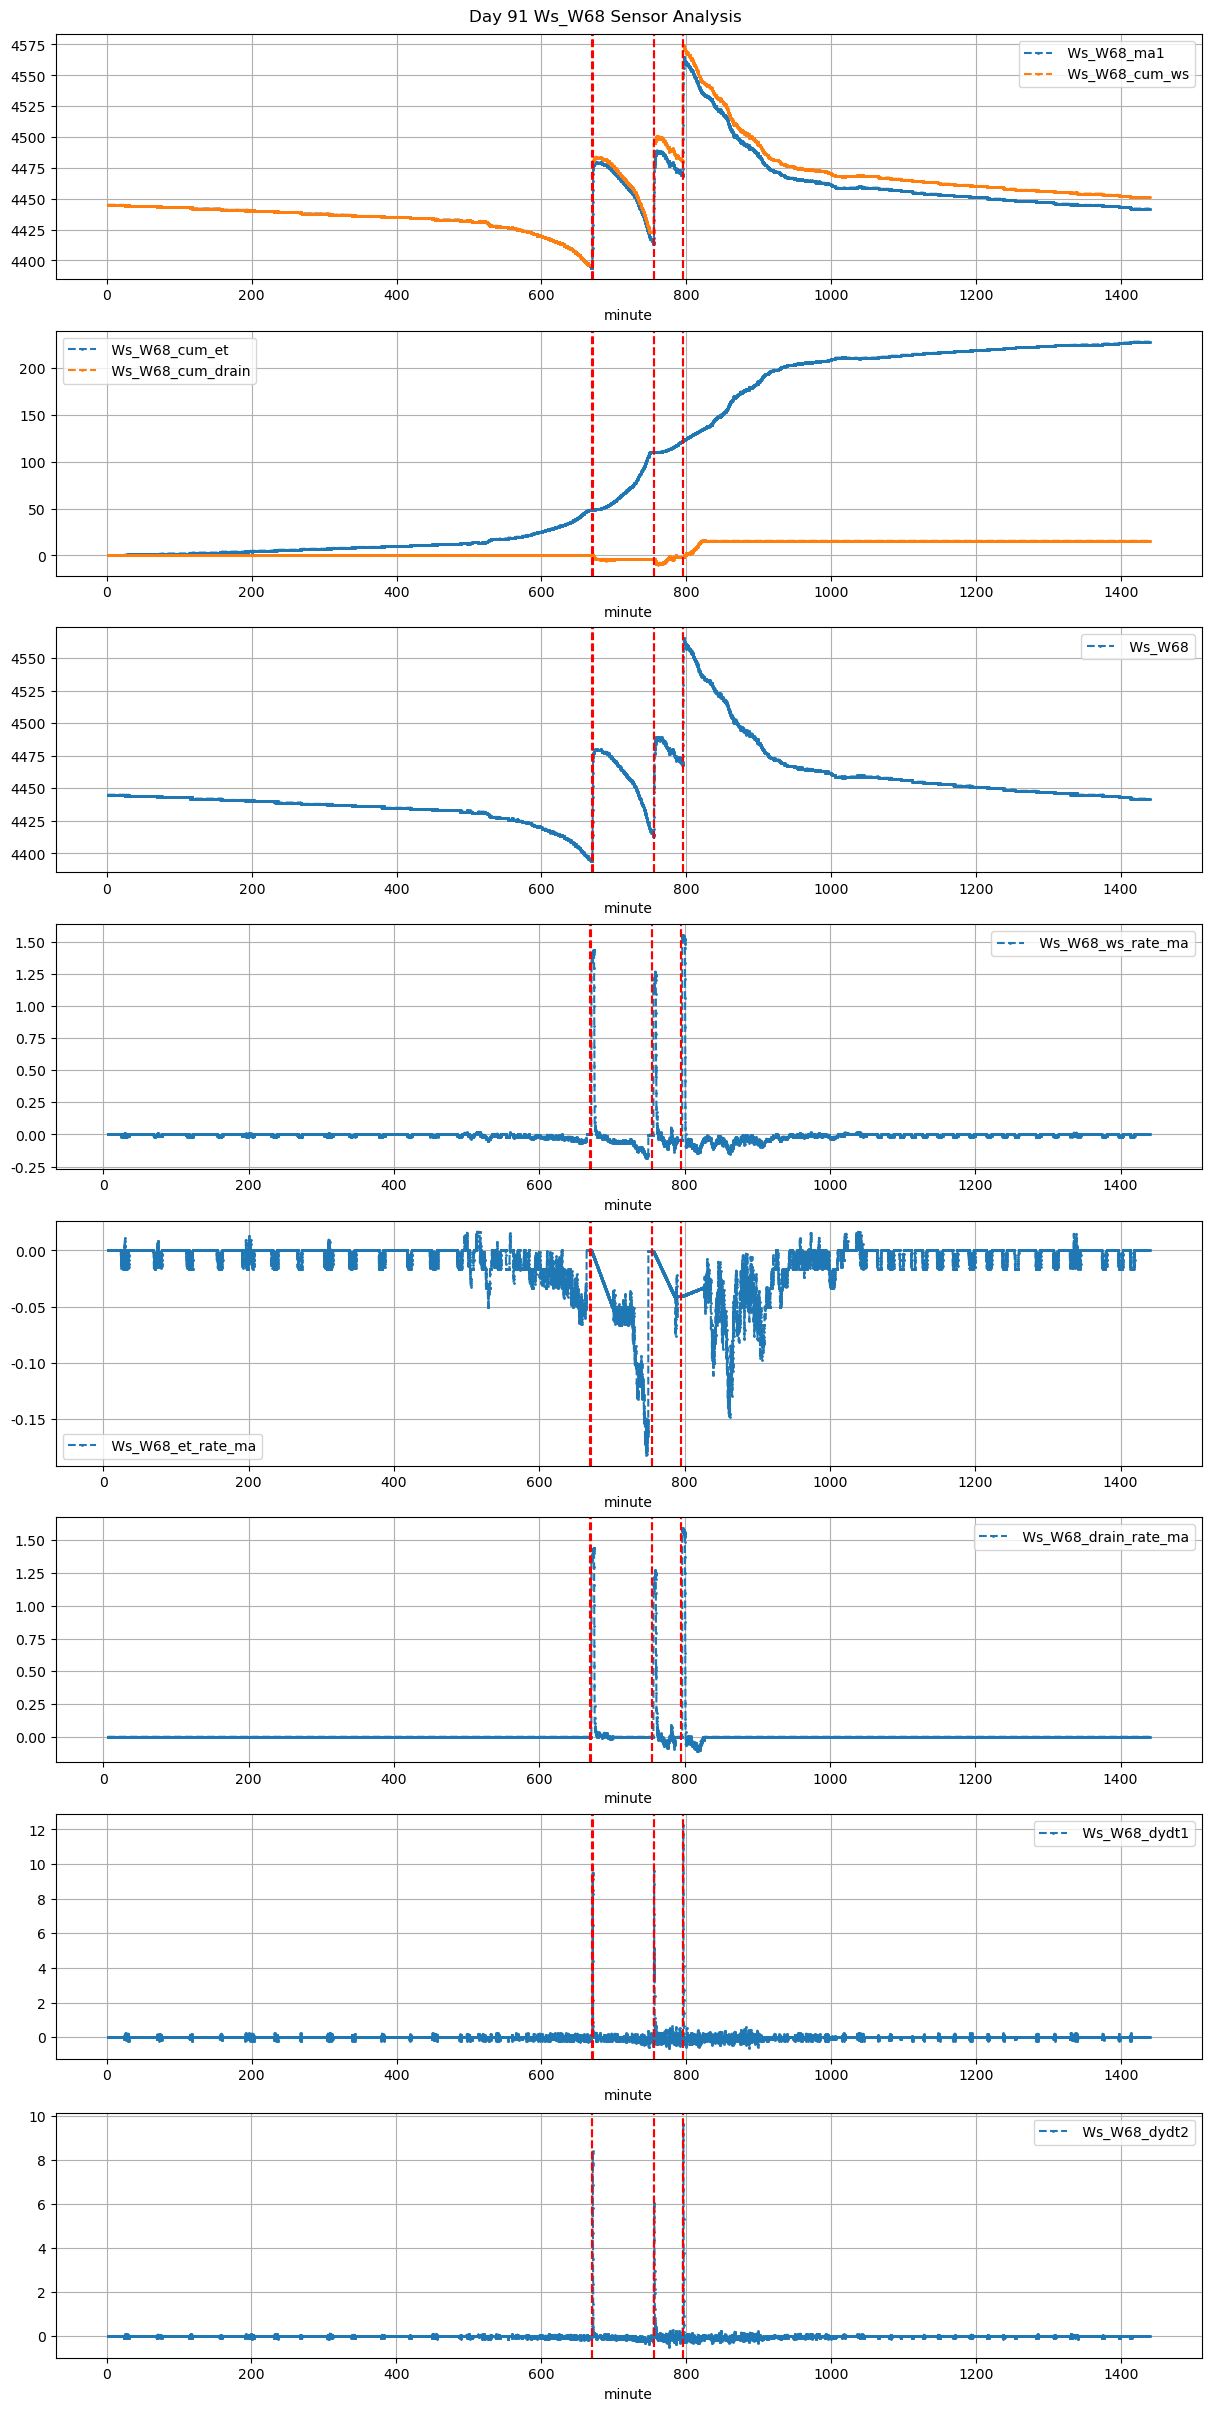
91 |
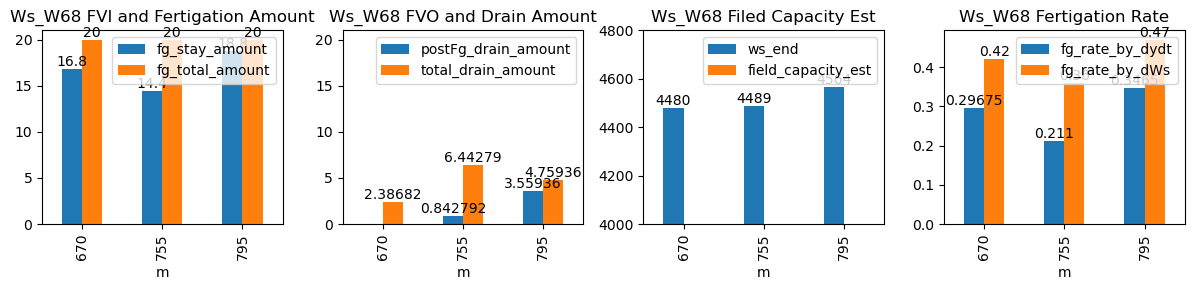
670 |
Ws_W68 |
0.270728 |
30 |
670.0 |
670.250000 |
670.67 |
671.666667 |
NaN |
NaN |
NaN |
4396.0 |
4480.0 |
40 |
-0.040678 |
0.000000 |
-0.052546 |
0.29675 |
0.42 |
16.8 |
15.0 |
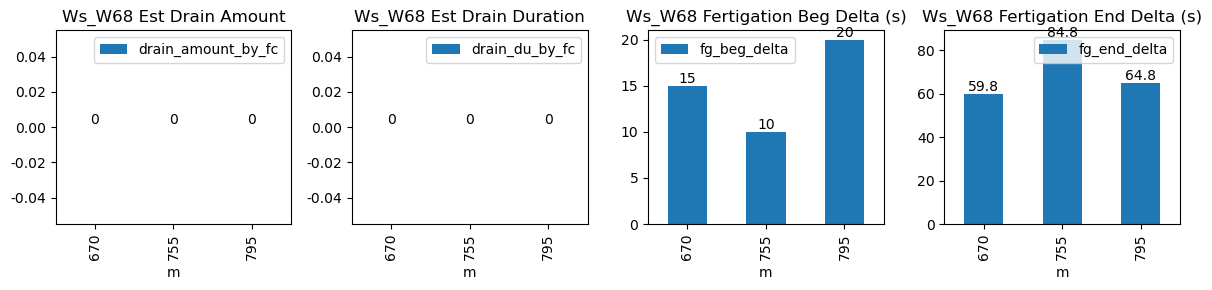
59.8 |
20.0 |
3.2 |
-0.813175 |
NaN |
2.386825 |
| 2026-01-05 12:35:00+08:00 |
91 |
755 |
Ws_W68 |
0.270728 |
30 |
755.0 |
755.166667 |
755.67 |
757.083333 |
NaN |
NaN |
NaN |
4417.0 |
4489.0 |
40 |
-0.107669 |
-0.000833 |
-0.042407 |
0.21100 |
0.36 |
14.4 |
10.0 |
84.8 |
20.0 |
5.6 |
0.842792 |
NaN |
6.442792 |
| 2026-01-05 13:15:00+08:00 |
91 |
795 |
Ws_W68 |
0.270728 |
30 |
795.0 |
795.333333 |
795.67 |
796.750000 |
NaN |
NaN |
NaN |
4470.0 |
4564.0 |
40 |
-0.040523 |
-0.067083 |
-0.032755 |
0.34650 |
0.47 |
18.8 |
20.0 |
64.8 |
20.0 |
1.2 |
3.559364 |
NaN |
4.759364 |