VI and VO Daily Summary
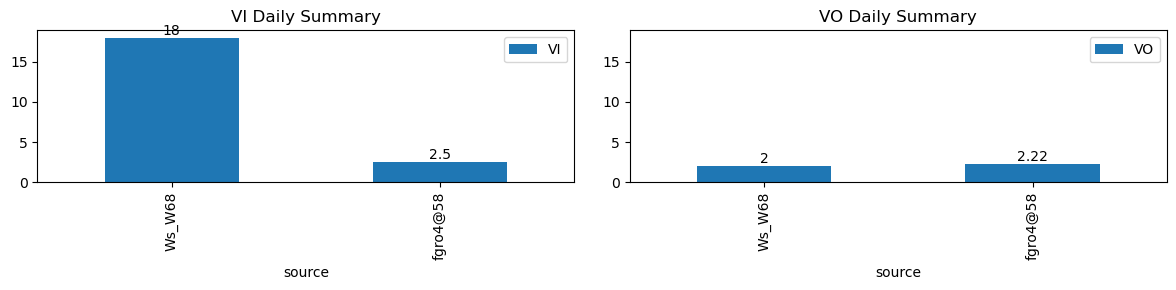
| ws_name | total_dp | nan_dp | nan_filled_dp | long_gap_dp | num_spike |
|---|---|---|---|---|---|
| Ws_W68 | 17269 | 0 | 14906 | 0 | 0 |
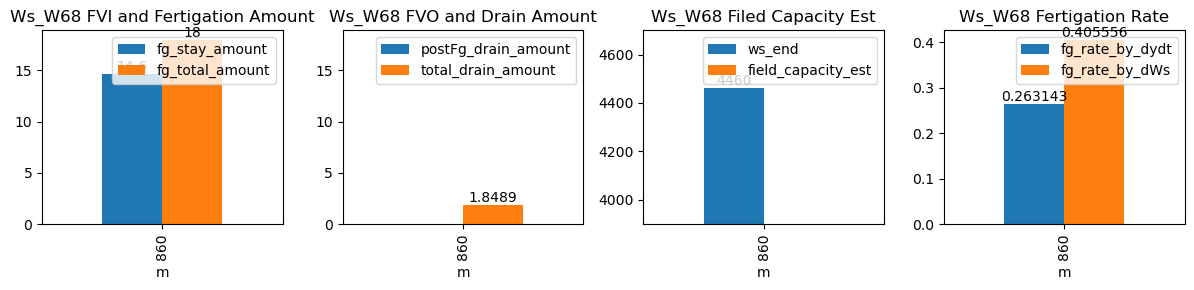
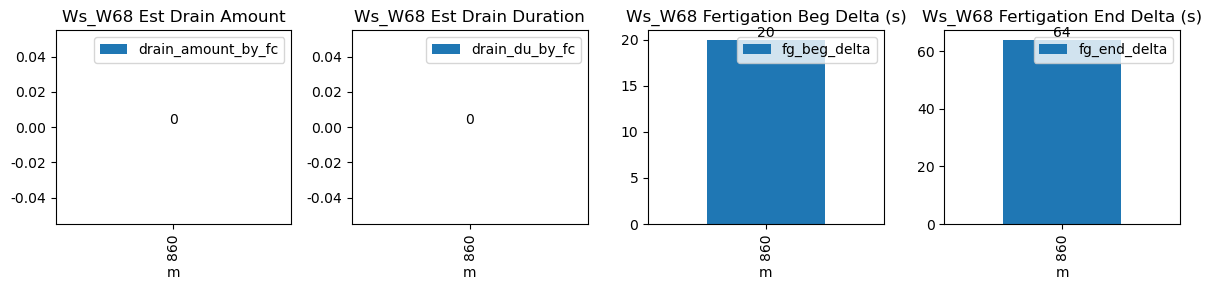
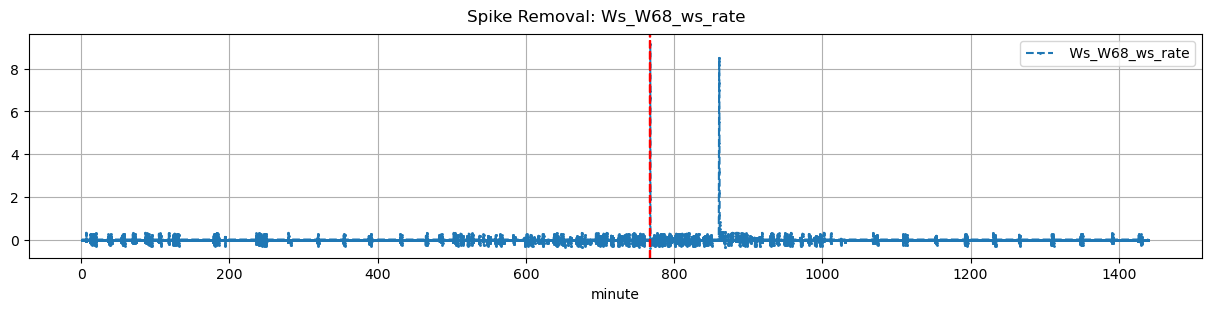
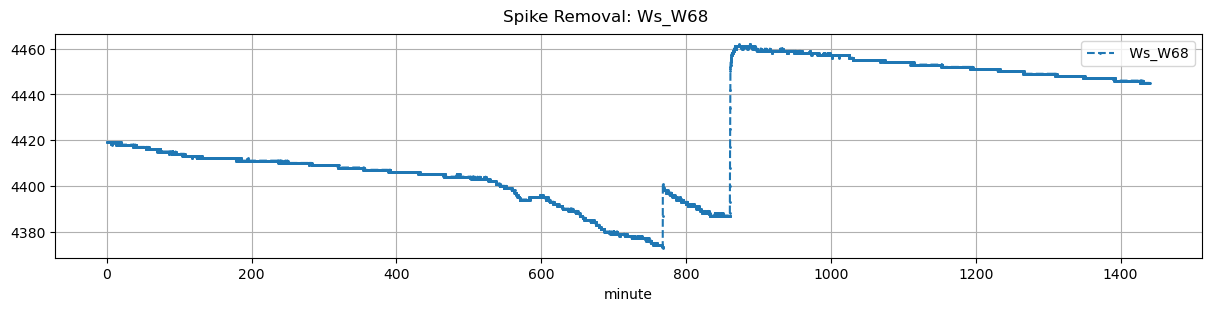
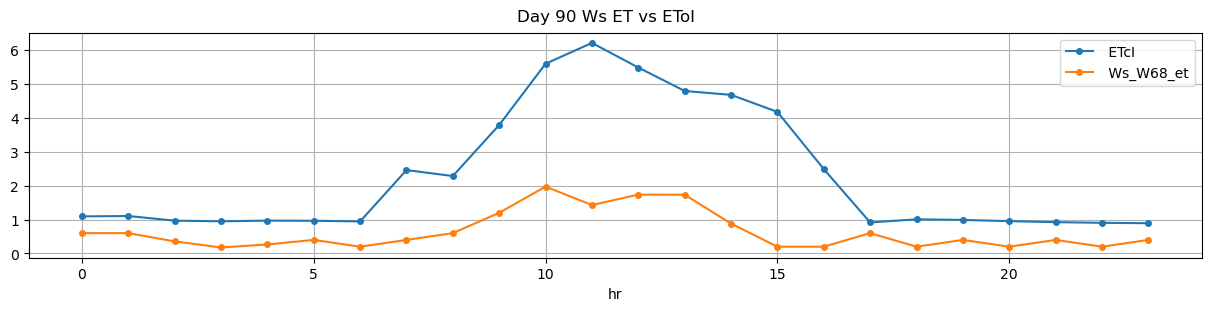
| ds | d | m | ws_name | prominence_cut | max_drain_du | fg_beg | fg_beg_est | fg_end | fg_end_est | drain_amount_by_fc | drain_du_by_fc | drain_rate_by_fc | ws_beg | ws_end | duc | pre_fg_et | post_fg_ws | post_drn_et | fg_rate_by_dydt | fg_rate_by_dWs | fg_stay_amount | fg_beg_delta | fg_end_delta | fg_total_amount | fg_drain_amount | postFg_drain_amount | field_capacity_est | total_drain_amount |
|---|---|---|---|---|---|---|---|---|---|---|---|---|---|---|---|---|---|---|---|---|---|---|---|---|---|---|---|---|
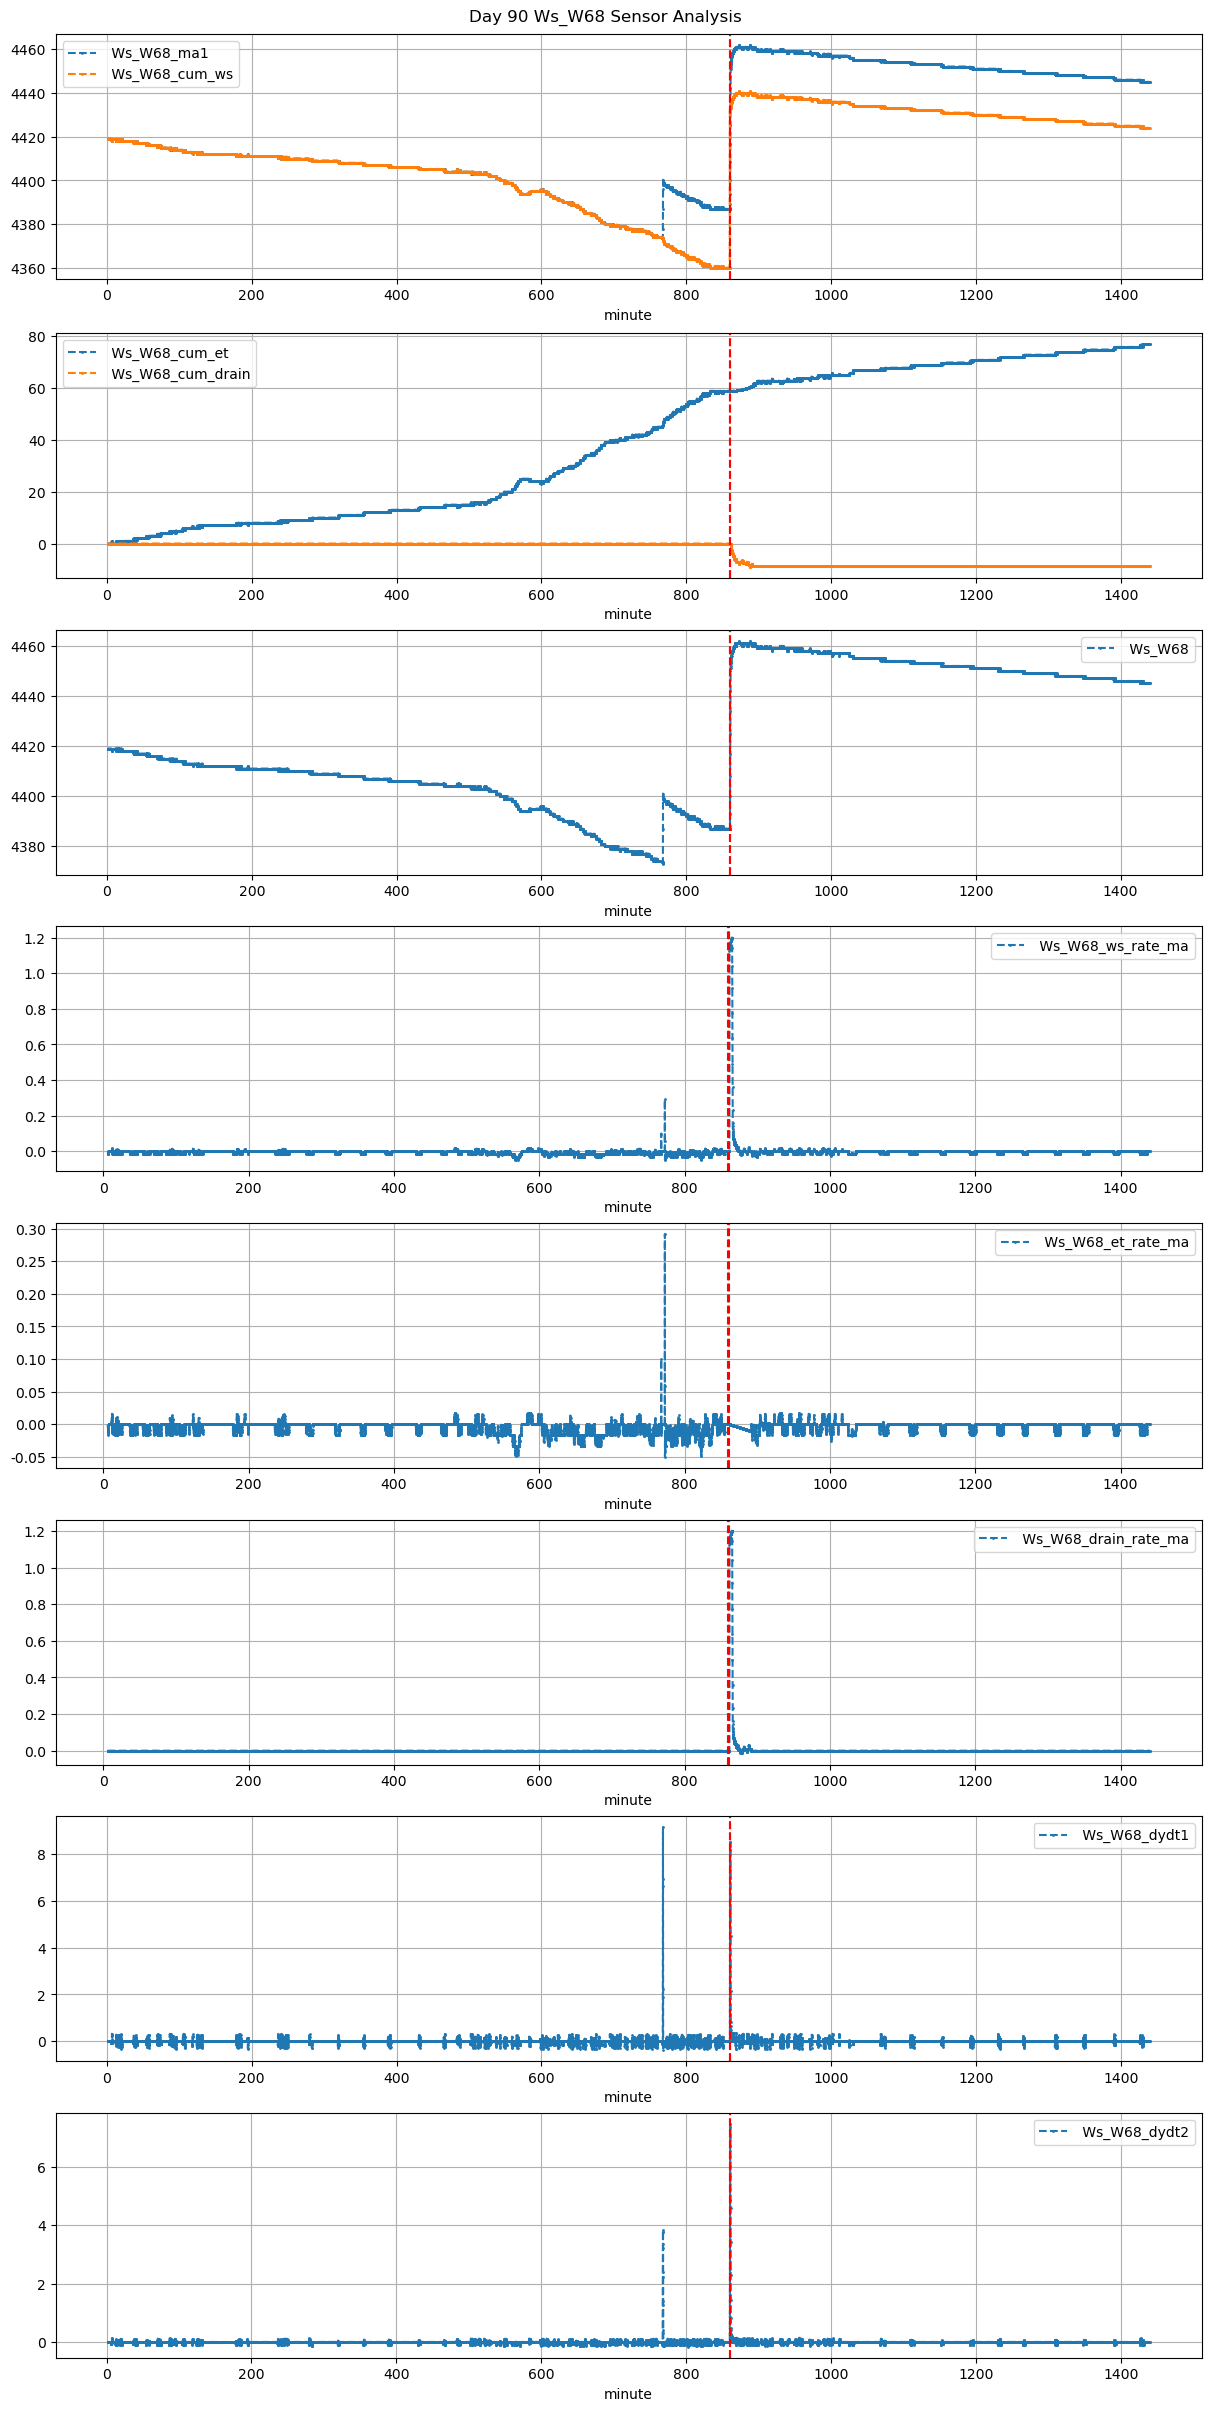
| 2026-01-04 14:20:00+08:00 | 90 | 860 | Ws_W68 | 0.125728 | 30 | 860.0 | 860.333333 | 860.6 | 861.666667 | NaN | NaN | NaN | 4387.0 | 4460.0 | 36 | -0.000918 | 0.0 | -0.010556 | 0.263143 | 0.405556 | 14.6 | 20.0 | 64.0 | 18.0 | 3.4 | -1.551103 | NaN | 1.848897 |