| 2026-04-03 08:22:14+08:00 |
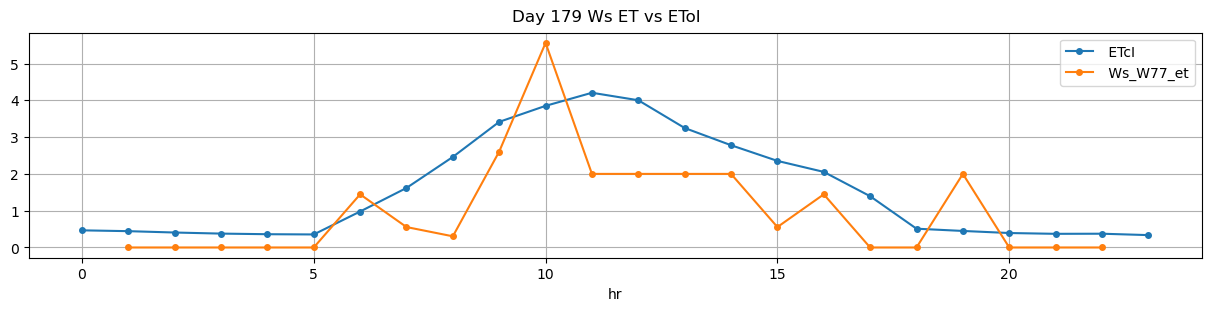
179 |
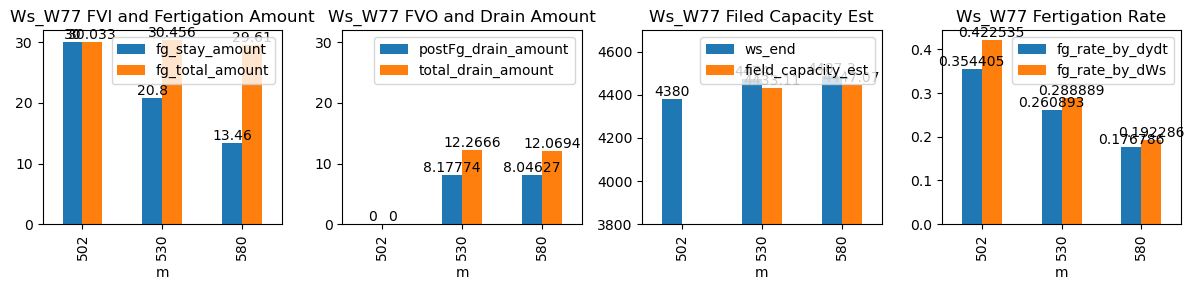
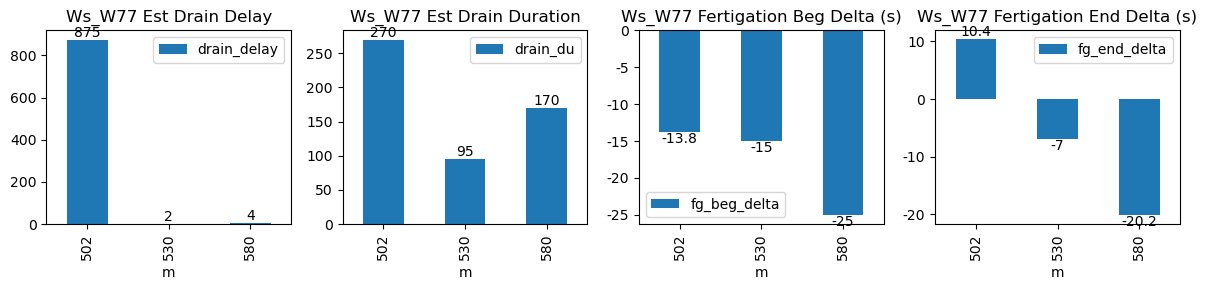
502 |
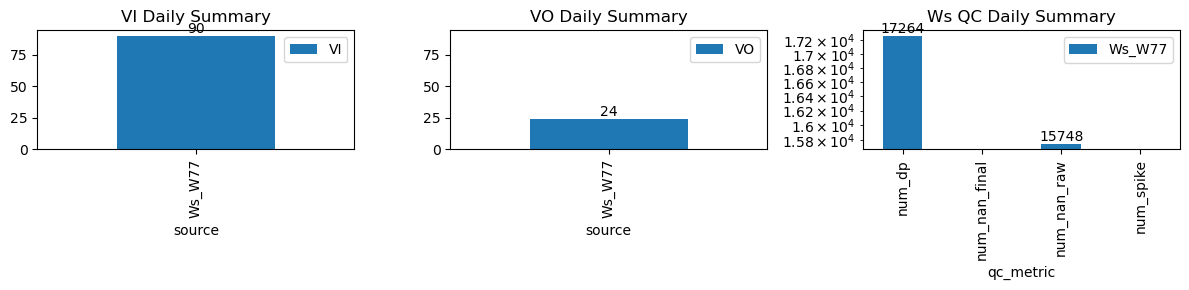
Ws_W77 |
2.256847 |
26.416667 |
502.23 |
502.000000 |
503.41 |
503.583333 |
4230.0 |
4380.0 |
71 |
0.00000 |
0.000000 |
0.000000 |
0.354405 |
0.422535 |
30.00 |
True |
-13.8 |
10.4 |
30.033 |
0.000000 |
0.000000 |
0.000000 |
270 |
875 |
-0.097769 |
NaN |
| 2026-04-03 08:50:00+08:00 |
179 |
530 |
Ws_W77 |
2.256847 |
30.000000 |
530.00 |
529.750000 |
531.20 |
531.083333 |
4370.0 |
4474.0 |
72 |
-0.02371 |
-0.038272 |
-0.054630 |
0.260893 |
0.288889 |
20.80 |
True |
-15.0 |
-7.0 |
30.456 |
4.088872 |
8.177743 |
12.266615 |
95 |
2 |
-0.155349 |
4433.111283 |
| 2026-04-03 09:40:00+08:00 |
179 |
580 |
Ws_W77 |
2.256847 |
30.000000 |
580.00 |
579.583333 |
581.17 |
580.833333 |
4420.0 |
4487.3 |
70 |
0.00000 |
-0.054444 |
-0.070988 |
0.176786 |
0.192286 |
13.46 |
True |
-25.0 |
-20.2 |
29.610 |
4.023133 |
8.046265 |
12.069398 |
170 |
4 |
-0.228082 |
4447.068673 |