VI and VO Daily Summary
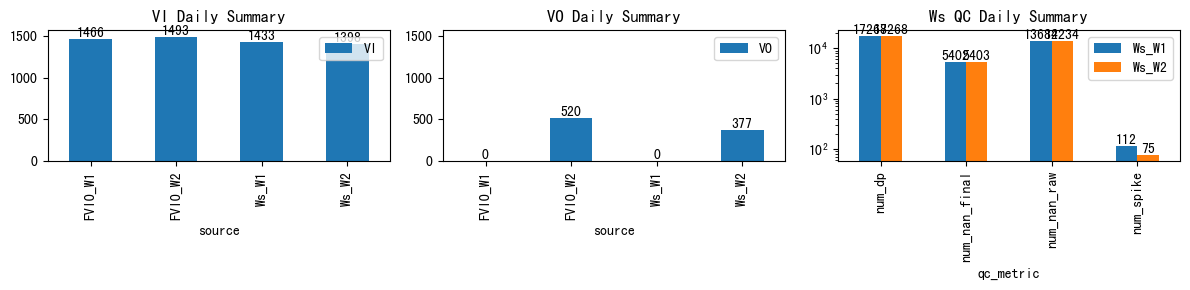
| ws_name | num_dp | num_nan_raw | num_nan_final | num_spike | cum_step_adj |
|---|---|---|---|---|---|
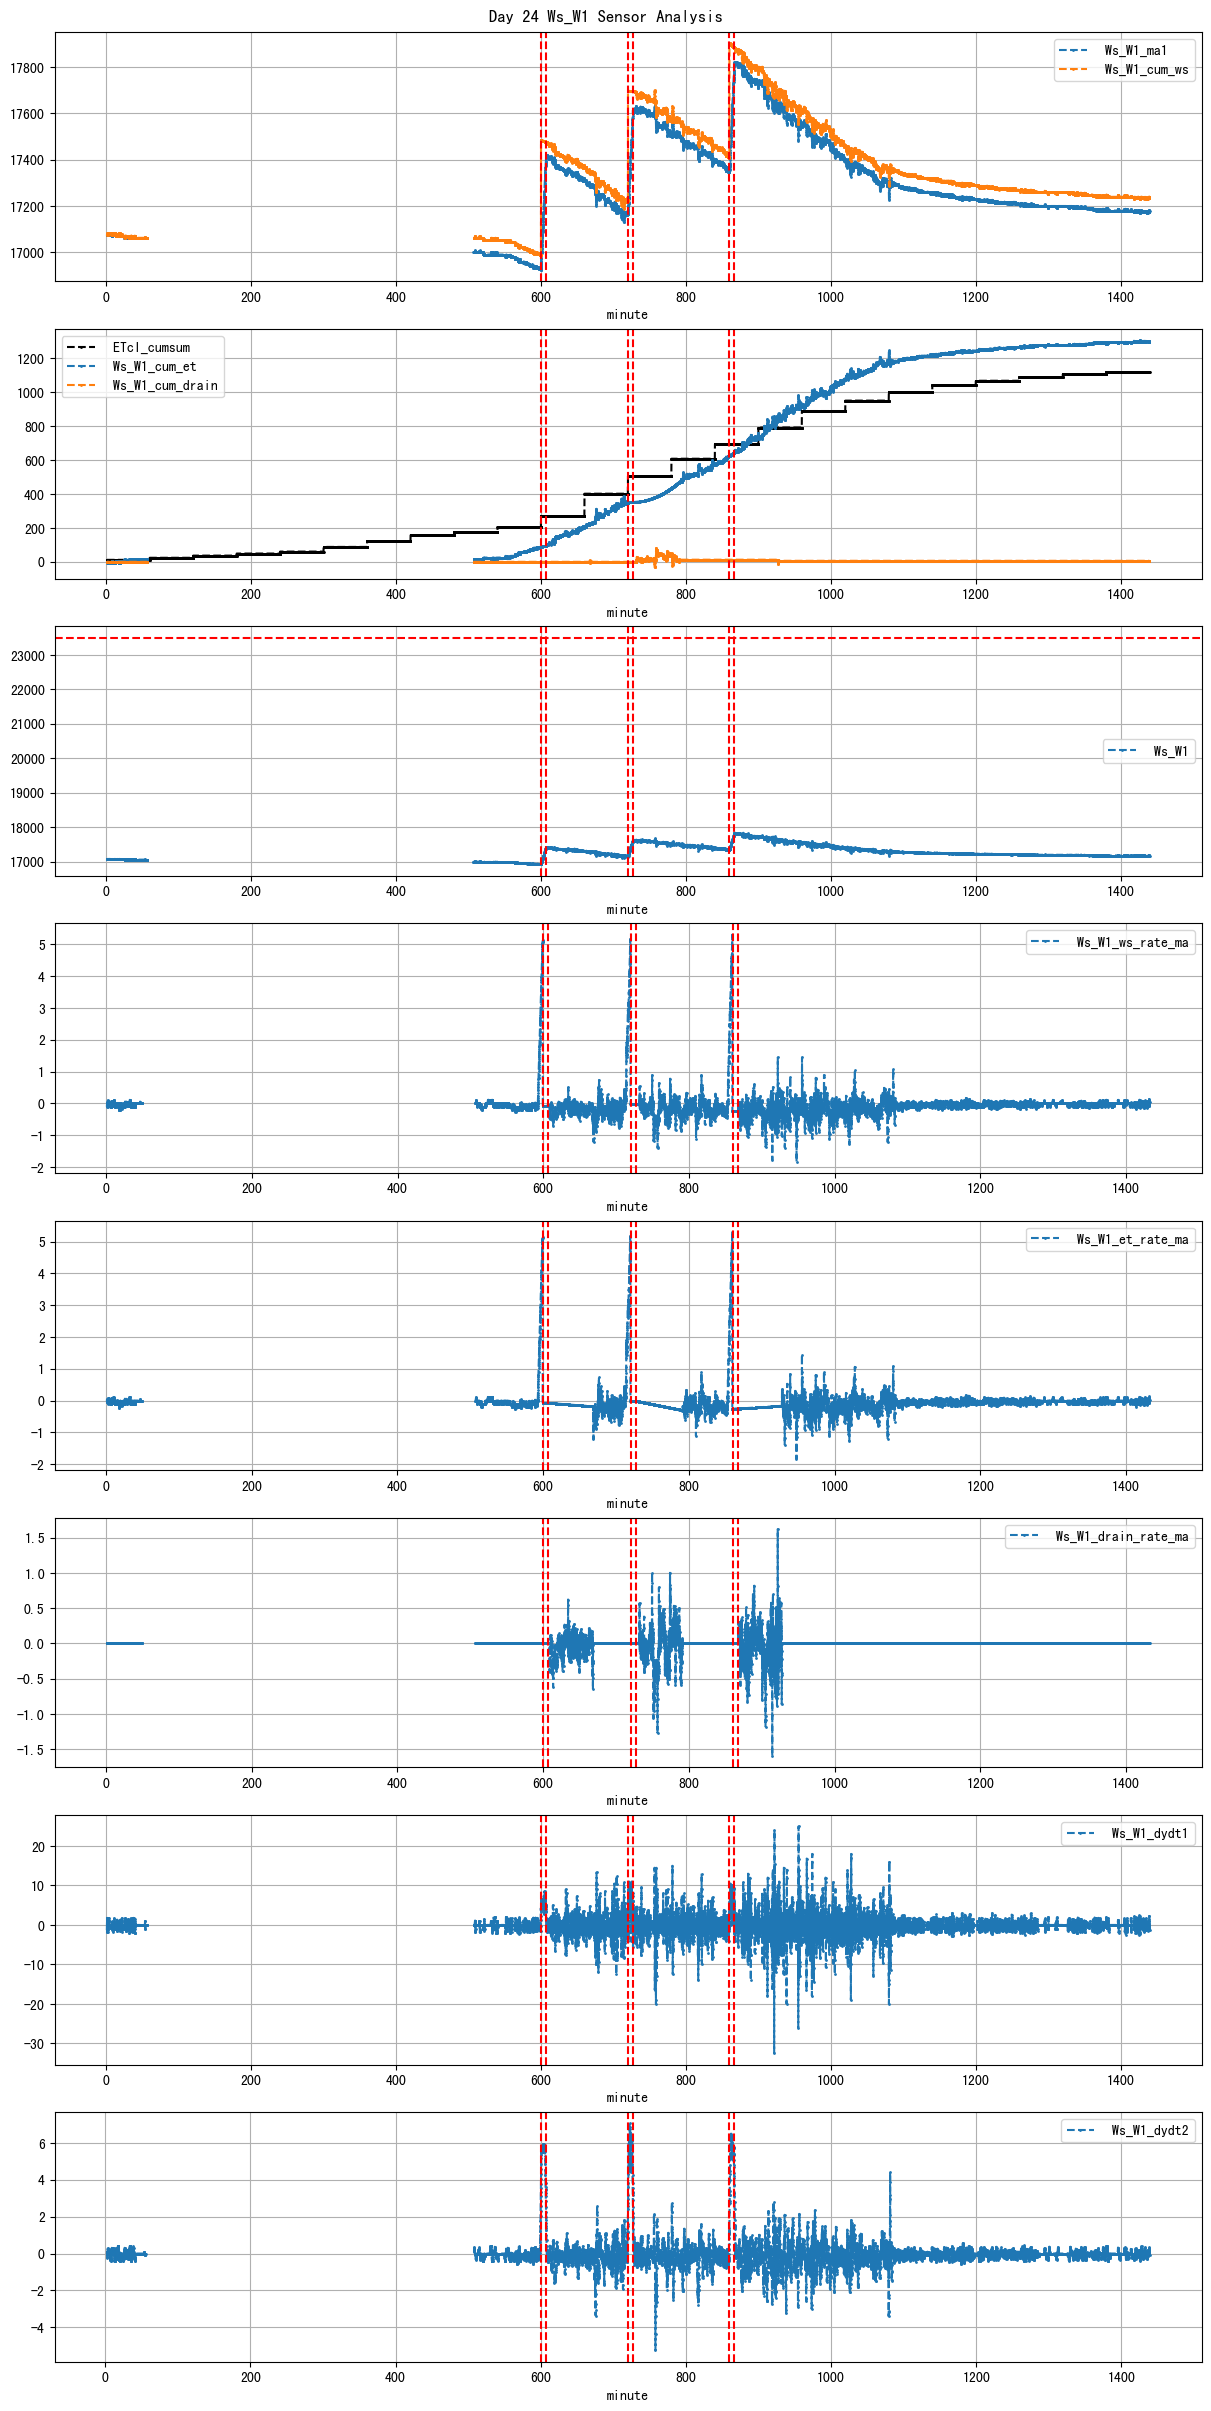
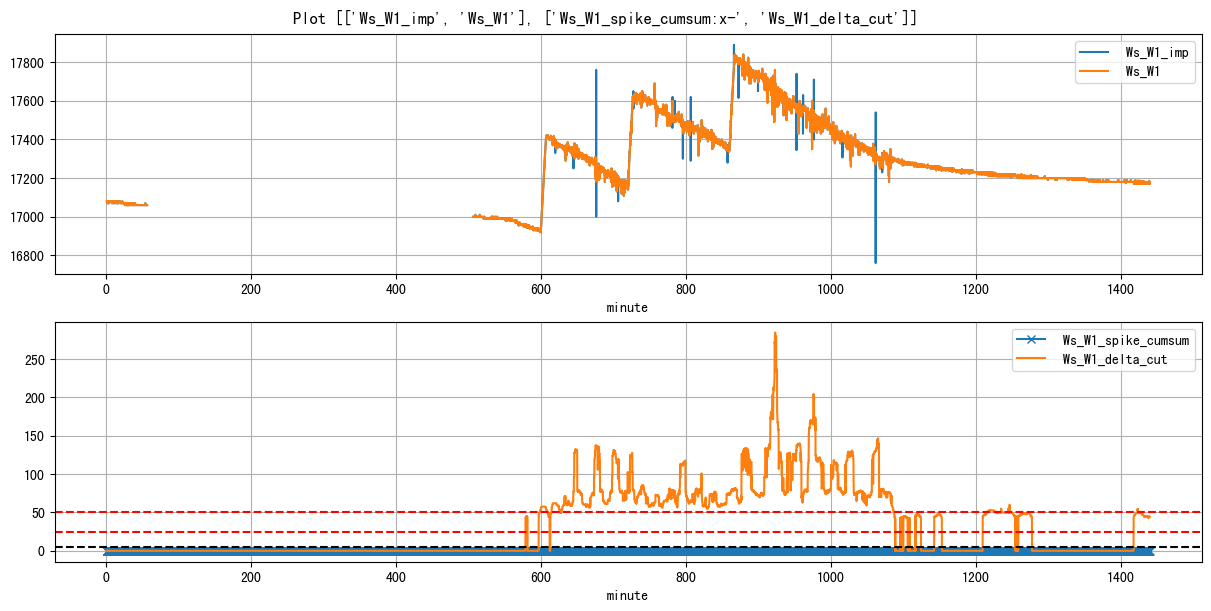
| Ws_W1 | 17,268 | 13,682 | 5,402 | 112 | 0.00 |
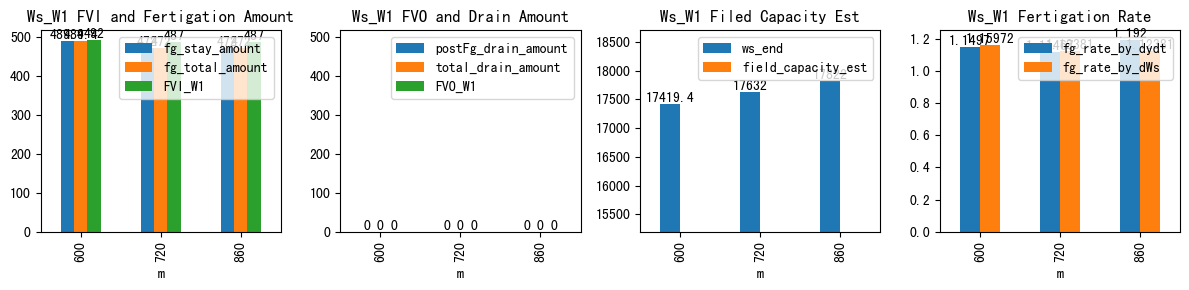
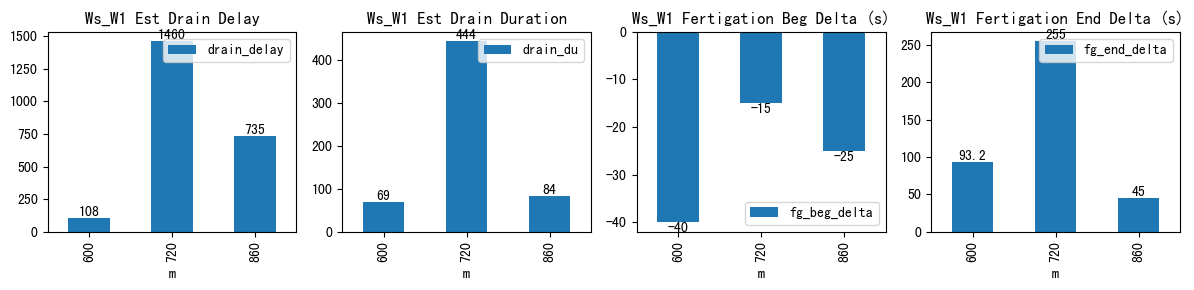
| ds | d | m | ws_name | prominence_cut | max_drain_du | fg_beg | fg_beg_est | fg_end | fg_end_est | ws_beg | ws_end | duc | pre_fg_et | post_fg_ws | post_drn_et | fg_rate_by_dydt | fg_rate_by_dWs | fg_stay_amount | enough_data | fg_beg_delta | fg_end_delta | fg_total_amount | fg_drain_amount | postFg_drain_amount | total_drain_amount | drain_du | drain_delay | drain_rate | field_capacity_est | FVI_W1 | FVO_W1 | FVI_W2 | FVO_W2 |
|---|---|---|---|---|---|---|---|---|---|---|---|---|---|---|---|---|---|---|---|---|---|---|---|---|---|---|---|---|---|---|---|---|---|
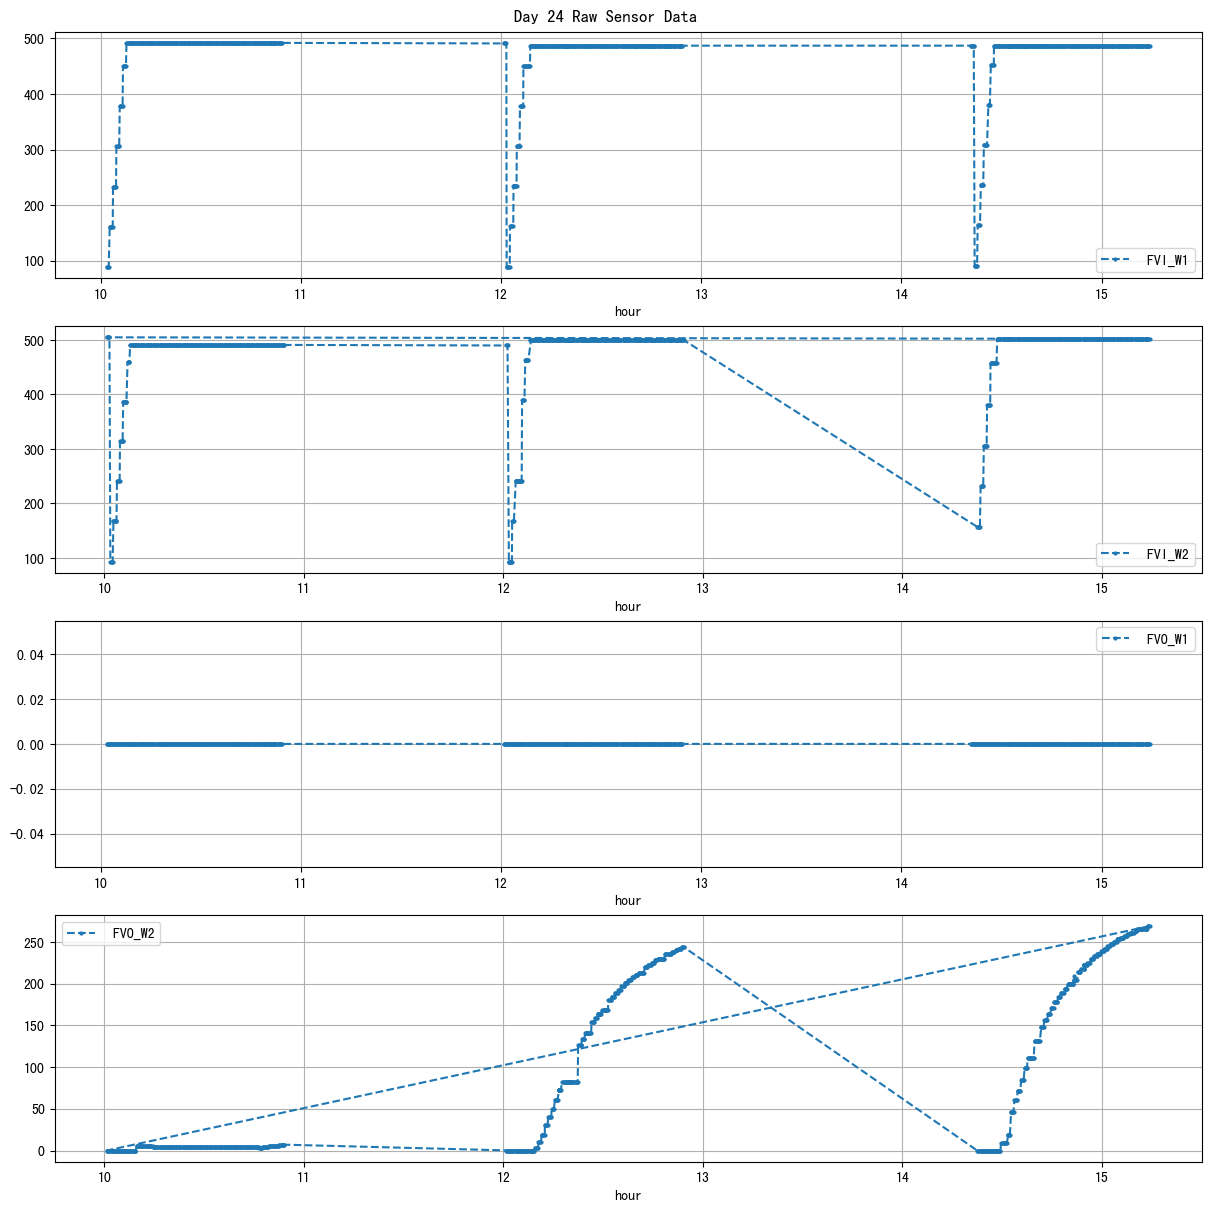
| 2026-03-25 10:00:00+08:00 | 24 | 600 | Ws_W1 | 2.032909 | 60 | 600.0 | 599.333333 | 607.03 | 608.583333 | 16930.0 | 17419.4 | 422 | -0.077344 | -0.250453 | -0.182716 | 1.149695 | 1.159716 | 489.4 | True | -40.0 | 93.2 | 489.4 | 0.0 | 0.0 | 0.0 | 69 | 108 | -0.336706 | NaN | 492.0 | 0.0 | NaN | NaN |
| 2026-03-25 12:00:00+08:00 | 24 | 720 | Ws_W1 | 2.032909 | 60 | 720.0 | 719.750000 | 727.00 | 731.250000 | 17160.0 | 17632.0 | 420 | -0.120058 | -0.028889 | -0.299383 | 1.114667 | 1.123810 | 472.0 | True | -15.0 | 255.0 | 472.0 | 0.0 | 0.0 | 0.0 | 444 | 1460 | -0.557522 | NaN | 487.0 | 0.0 | NaN | NaN |
| 2026-03-25 14:20:00+08:00 | 24 | 860 | Ws_W1 | 2.032909 | 60 | 860.0 | 859.583333 | 867.00 | 867.750000 | 17350.0 | 17822.0 | 420 | -0.252898 | -0.294136 | -0.166049 | 1.192000 | 1.123810 | 472.0 | True | -25.0 | 45.0 | 472.0 | 0.0 | 0.0 | 0.0 | 84 | 735 | -0.651605 | NaN | 487.0 | 0.0 | NaN | NaN |
| ws_name | num_dp | num_nan_raw | num_nan_final | num_spike | cum_step_adj |
|---|---|---|---|---|---|
| Ws_W2 | 17,268 | 14,234 | 5,403 | 75 | 0.00 |
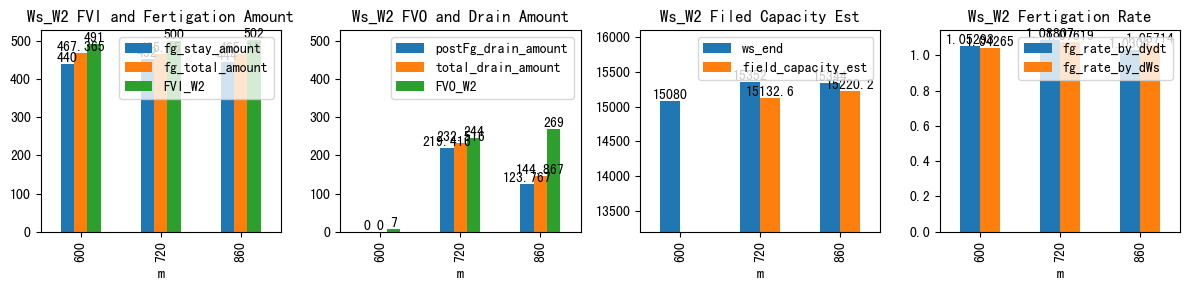
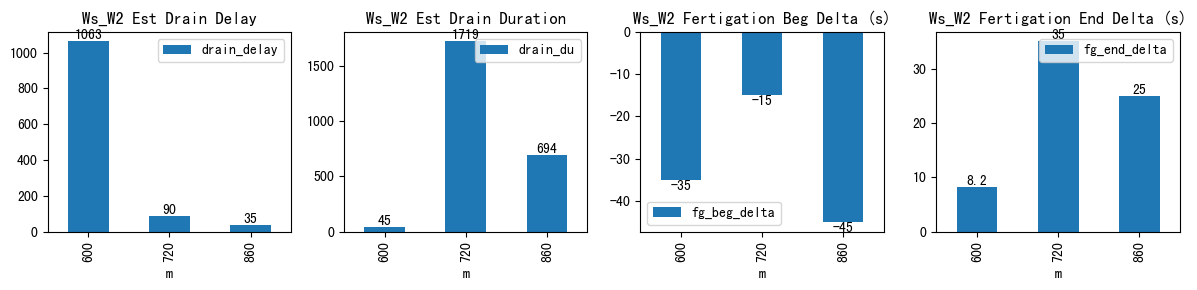
| ds | d | m | ws_name | prominence_cut | max_drain_du | fg_beg | fg_beg_est | fg_end | fg_end_est | ws_beg | ws_end | duc | pre_fg_et | post_fg_ws | post_drn_et | fg_rate_by_dydt | fg_rate_by_dWs | fg_stay_amount | enough_data | fg_beg_delta | fg_end_delta | fg_total_amount | fg_drain_amount | postFg_drain_amount | total_drain_amount | drain_du | drain_delay | drain_rate | field_capacity_est | FVI_W1 | FVO_W1 | FVI_W2 | FVO_W2 |
|---|---|---|---|---|---|---|---|---|---|---|---|---|---|---|---|---|---|---|---|---|---|---|---|---|---|---|---|---|---|---|---|---|---|
| 2026-03-25 10:00:00+08:00 | 24 | 600 | Ws_W2 | 1.43177 | 60 | 600.0 | 599.416667 | 607.03 | 607.166667 | 14640.0 | 15080.0 | 422 | -0.136080 | -0.071840 | -0.171759 | 1.052933 | 1.042654 | 440.0 | True | -35.0 | 8.2 | 467.365 | 0.0 | 0.000000 | 0.000000 | 45 | 1063 | -0.196230 | NaN | NaN | NaN | 491.0 | 7.0 |
| 2026-03-25 12:00:00+08:00 | 24 | 720 | Ws_W2 | 1.43177 | 60 | 720.0 | 719.750000 | 727.00 | 727.583333 | 14900.0 | 15352.0 | 420 | -0.071681 | -0.874568 | -0.126955 | 1.088067 | 1.076190 | 452.0 | True | -15.0 | 35.0 | 465.150 | 13.1 | 219.416439 | 232.516439 | 1719 | 90 | -0.831754 | 15132.583561 | NaN | NaN | 500.0 | 244.0 |
| 2026-03-25 14:20:00+08:00 | 24 | 860 | Ws_W2 | 1.43177 | 60 | 860.0 | 859.250000 | 867.00 | 867.416667 | 14900.0 | 15344.0 | 420 | -0.242270 | -1.029424 | -0.229012 | 1.030400 | 1.057143 | 444.0 | True | -45.0 | 25.0 | 465.150 | 21.1 | 123.766765 | 144.866765 | 694 | 35 | -0.860122 | 15220.233235 | NaN | NaN | 502.0 | 269.0 |