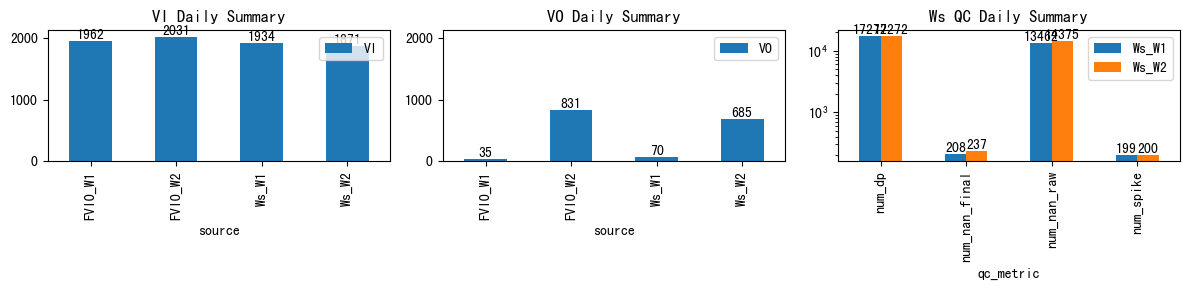
VI and VO Daily Summary
| ws_name | num_dp | num_nan_raw | num_nan_final | num_spike | cum_step_adj |
|---|---|---|---|---|---|
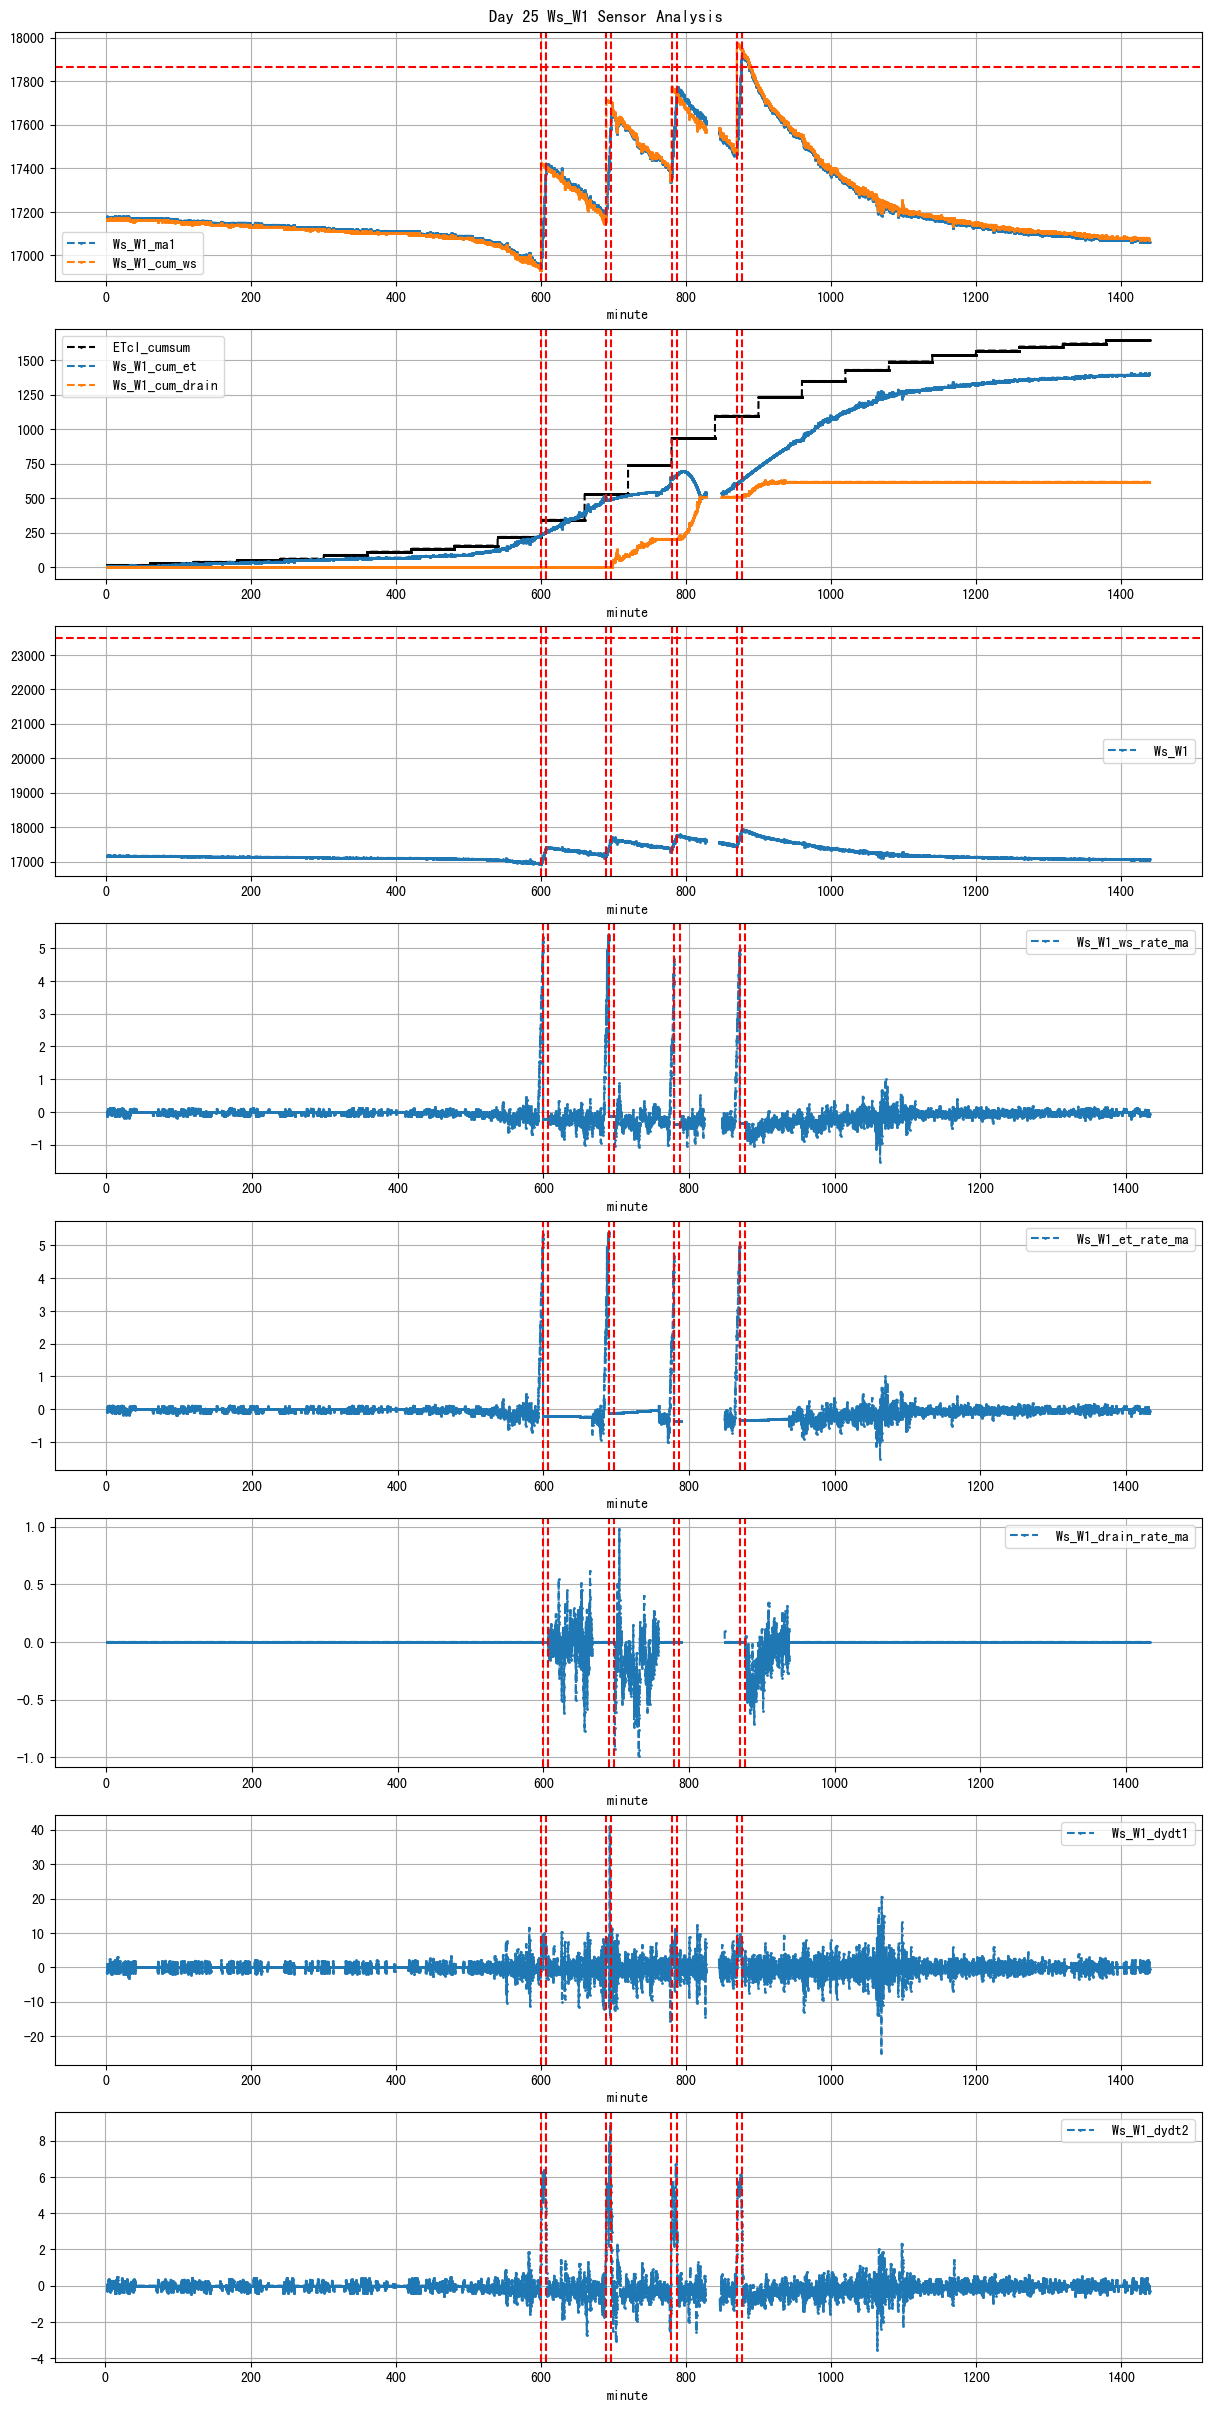
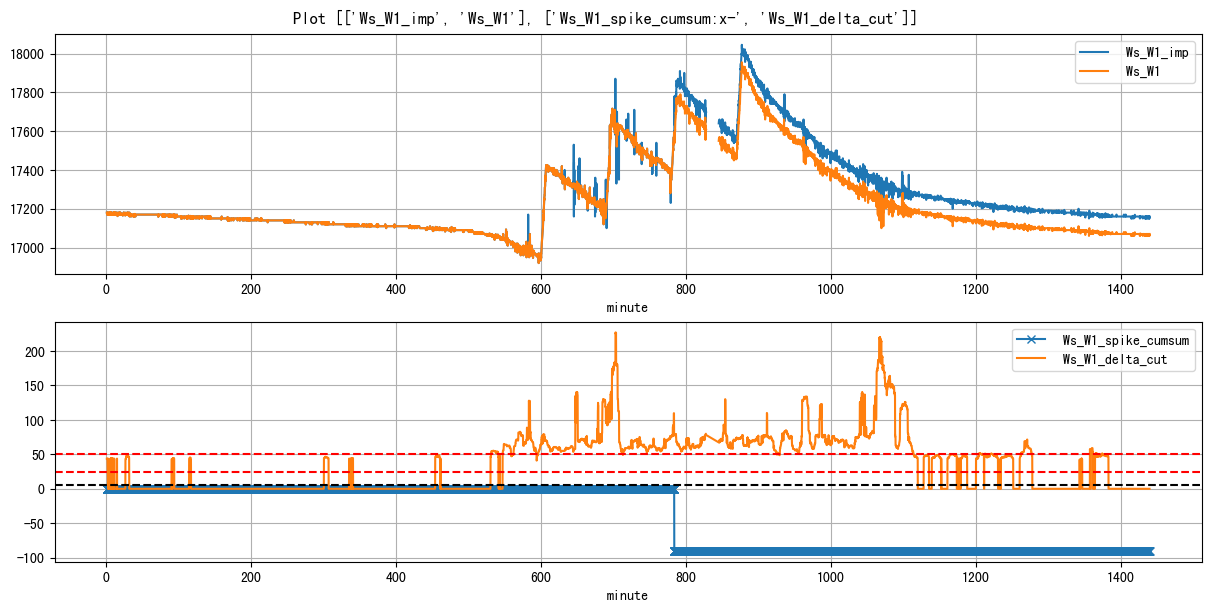
| Ws_W1 | 17,272 | 13,462 | 208 | 199 | -90.00 |
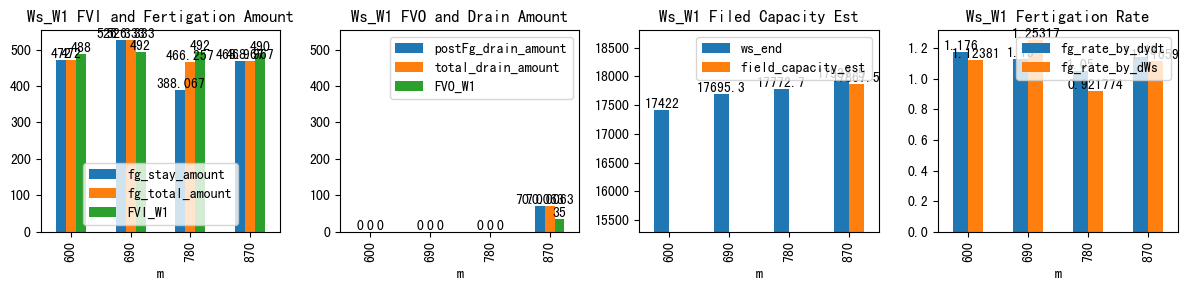
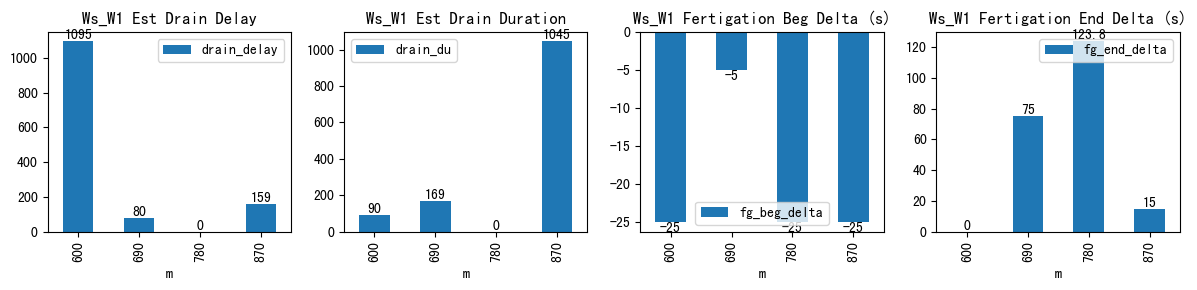
| ds | d | m | ws_name | prominence_cut | max_drain_du | fg_beg | fg_beg_est | fg_end | fg_end_est | ws_beg | ws_end | duc | pre_fg_et | post_fg_ws | post_drn_et | fg_rate_by_dydt | fg_rate_by_dWs | fg_stay_amount | enough_data | fg_beg_delta | fg_end_delta | fg_total_amount | fg_drain_amount | postFg_drain_amount | total_drain_amount | drain_du | drain_delay | drain_rate | field_capacity_est | FVI_W1 | FVO_W1 | FVI_W2 | FVO_W2 |
|---|---|---|---|---|---|---|---|---|---|---|---|---|---|---|---|---|---|---|---|---|---|---|---|---|---|---|---|---|---|---|---|---|---|
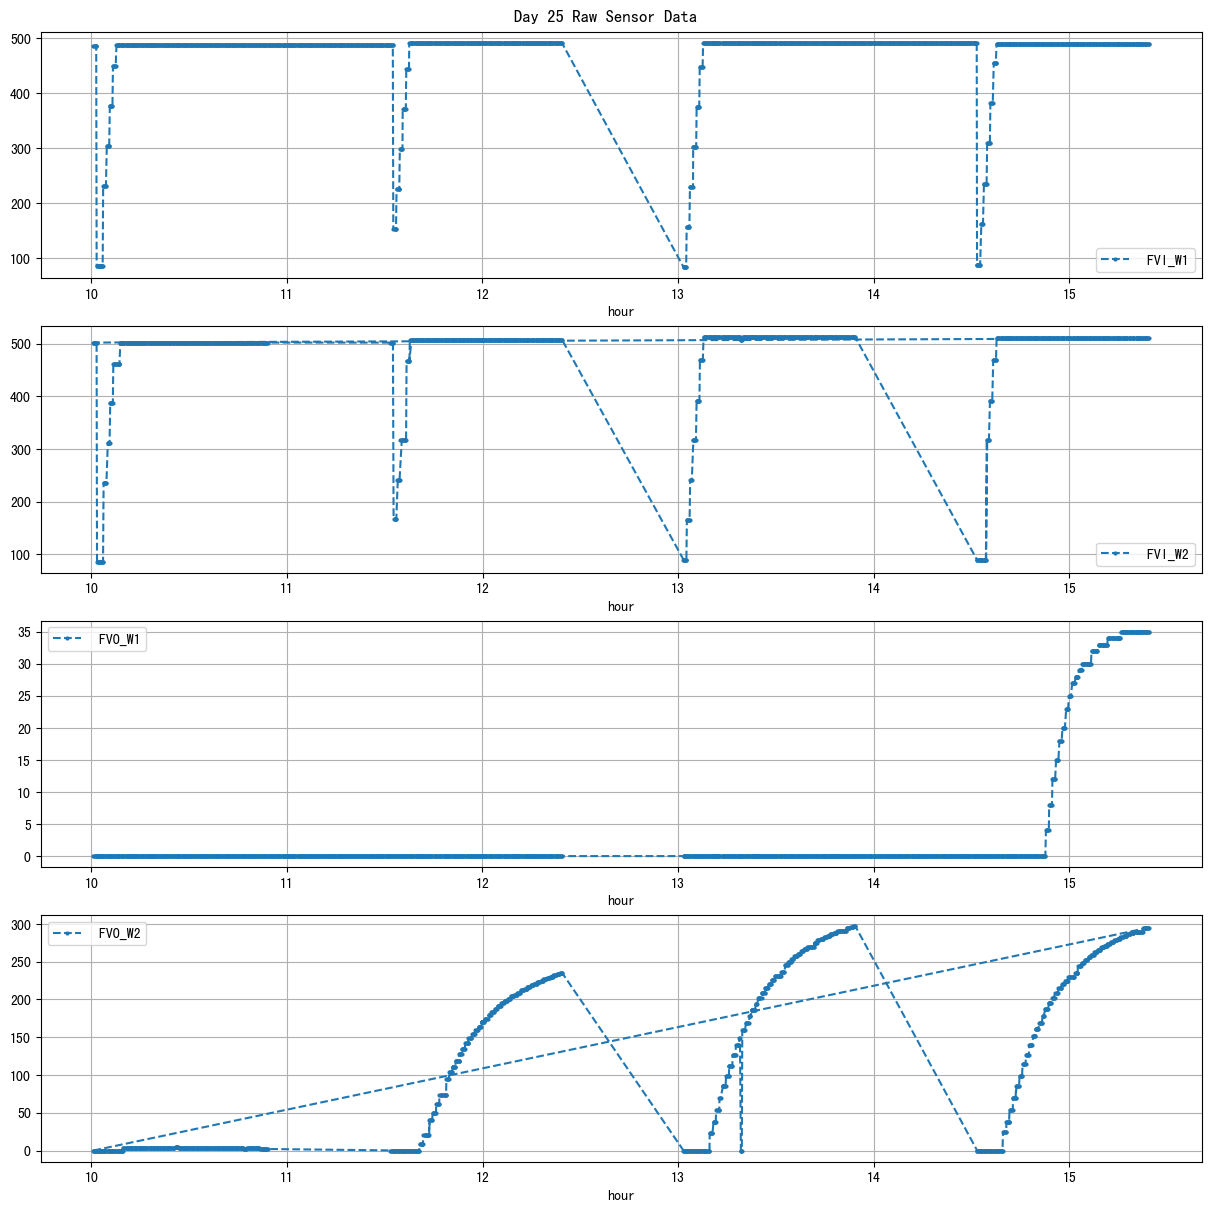
| 2026-03-26 10:00:00+08:00 | 25 | 600 | Ws_W1 | 1.501359 | 60 | 600.0 | 599.583333 | 607.00 | 607.000000 | 16950.000000 | 17422.000000 | 420 | -0.209307 | -0.211768 | -0.227837 | 1.176 | 1.123810 | 472.000000 | True | -25.0 | 0.0 | 472.000000 | 0.0 | 0.000000 | 0.000000 | 90.0 | 1095.0 | -0.386050 | NaN | 488.0 | 0.0 | NaN | NaN |
| 2026-03-26 11:30:00+08:00 | 25 | 690 | Ws_W1 | 1.501359 | 60 | 690.0 | 689.916667 | 697.00 | 698.250000 | 17169.000000 | 17695.333333 | 420 | -0.394668 | -0.118200 | -0.021811 | 1.130 | 1.253175 | 526.333333 | True | -5.0 | 75.0 | 526.333333 | 0.0 | 0.000000 | 0.000000 | 169.0 | 80.0 | -0.575020 | NaN | 492.0 | 0.0 | NaN | NaN |
| 2026-03-26 13:00:00+08:00 | 25 | 780 | Ws_W1 | 1.501359 | 60 | 780.0 | 779.583333 | 787.02 | 789.083333 | 17384.600000 | 17772.666667 | 421 | -0.379213 | -0.371283 | -0.298416 | 1.050 | 0.921774 | 388.066667 | True | -25.0 | 123.8 | 466.257500 | 0.0 | 0.000000 | 0.000000 | NaN | NaN | NaN | NaN | 492.0 | 0.0 | NaN | NaN |
| 2026-03-26 14:30:00+08:00 | 25 | 870 | Ws_W1 | 1.501359 | 60 | 870.0 | 869.583333 | 877.00 | 877.250000 | 17468.533333 | 17937.500000 | 420 | -0.342634 | -0.587577 | -0.288107 | 1.143 | 1.116587 | 468.966667 | True | -25.0 | 15.0 | 468.966667 | 0.0 | 70.006256 | 70.006256 | 1045.0 | 159.0 | -0.474799 | 17867.493744 | 490.0 | 35.0 | NaN | NaN |
| ws_name | num_dp | num_nan_raw | num_nan_final | num_spike | cum_step_adj |
|---|---|---|---|---|---|
| Ws_W2 | 17,272 | 14,375 | 237 | 200 | 6.67 |
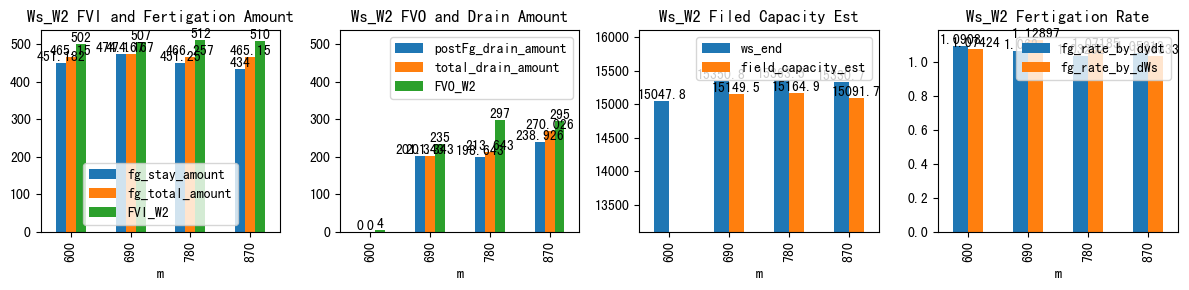
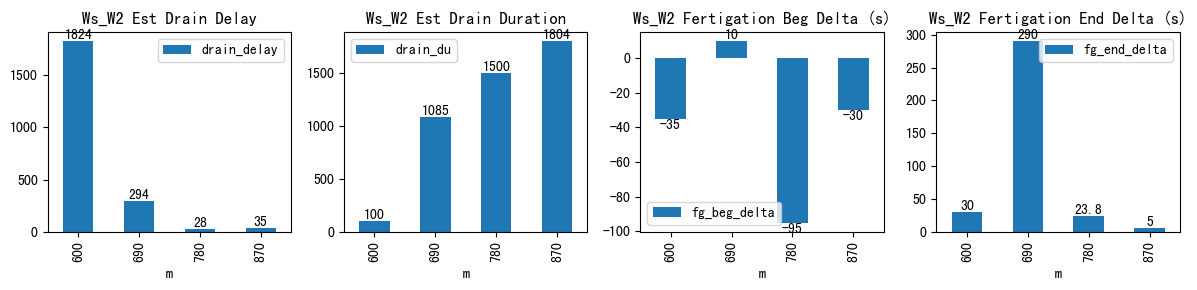
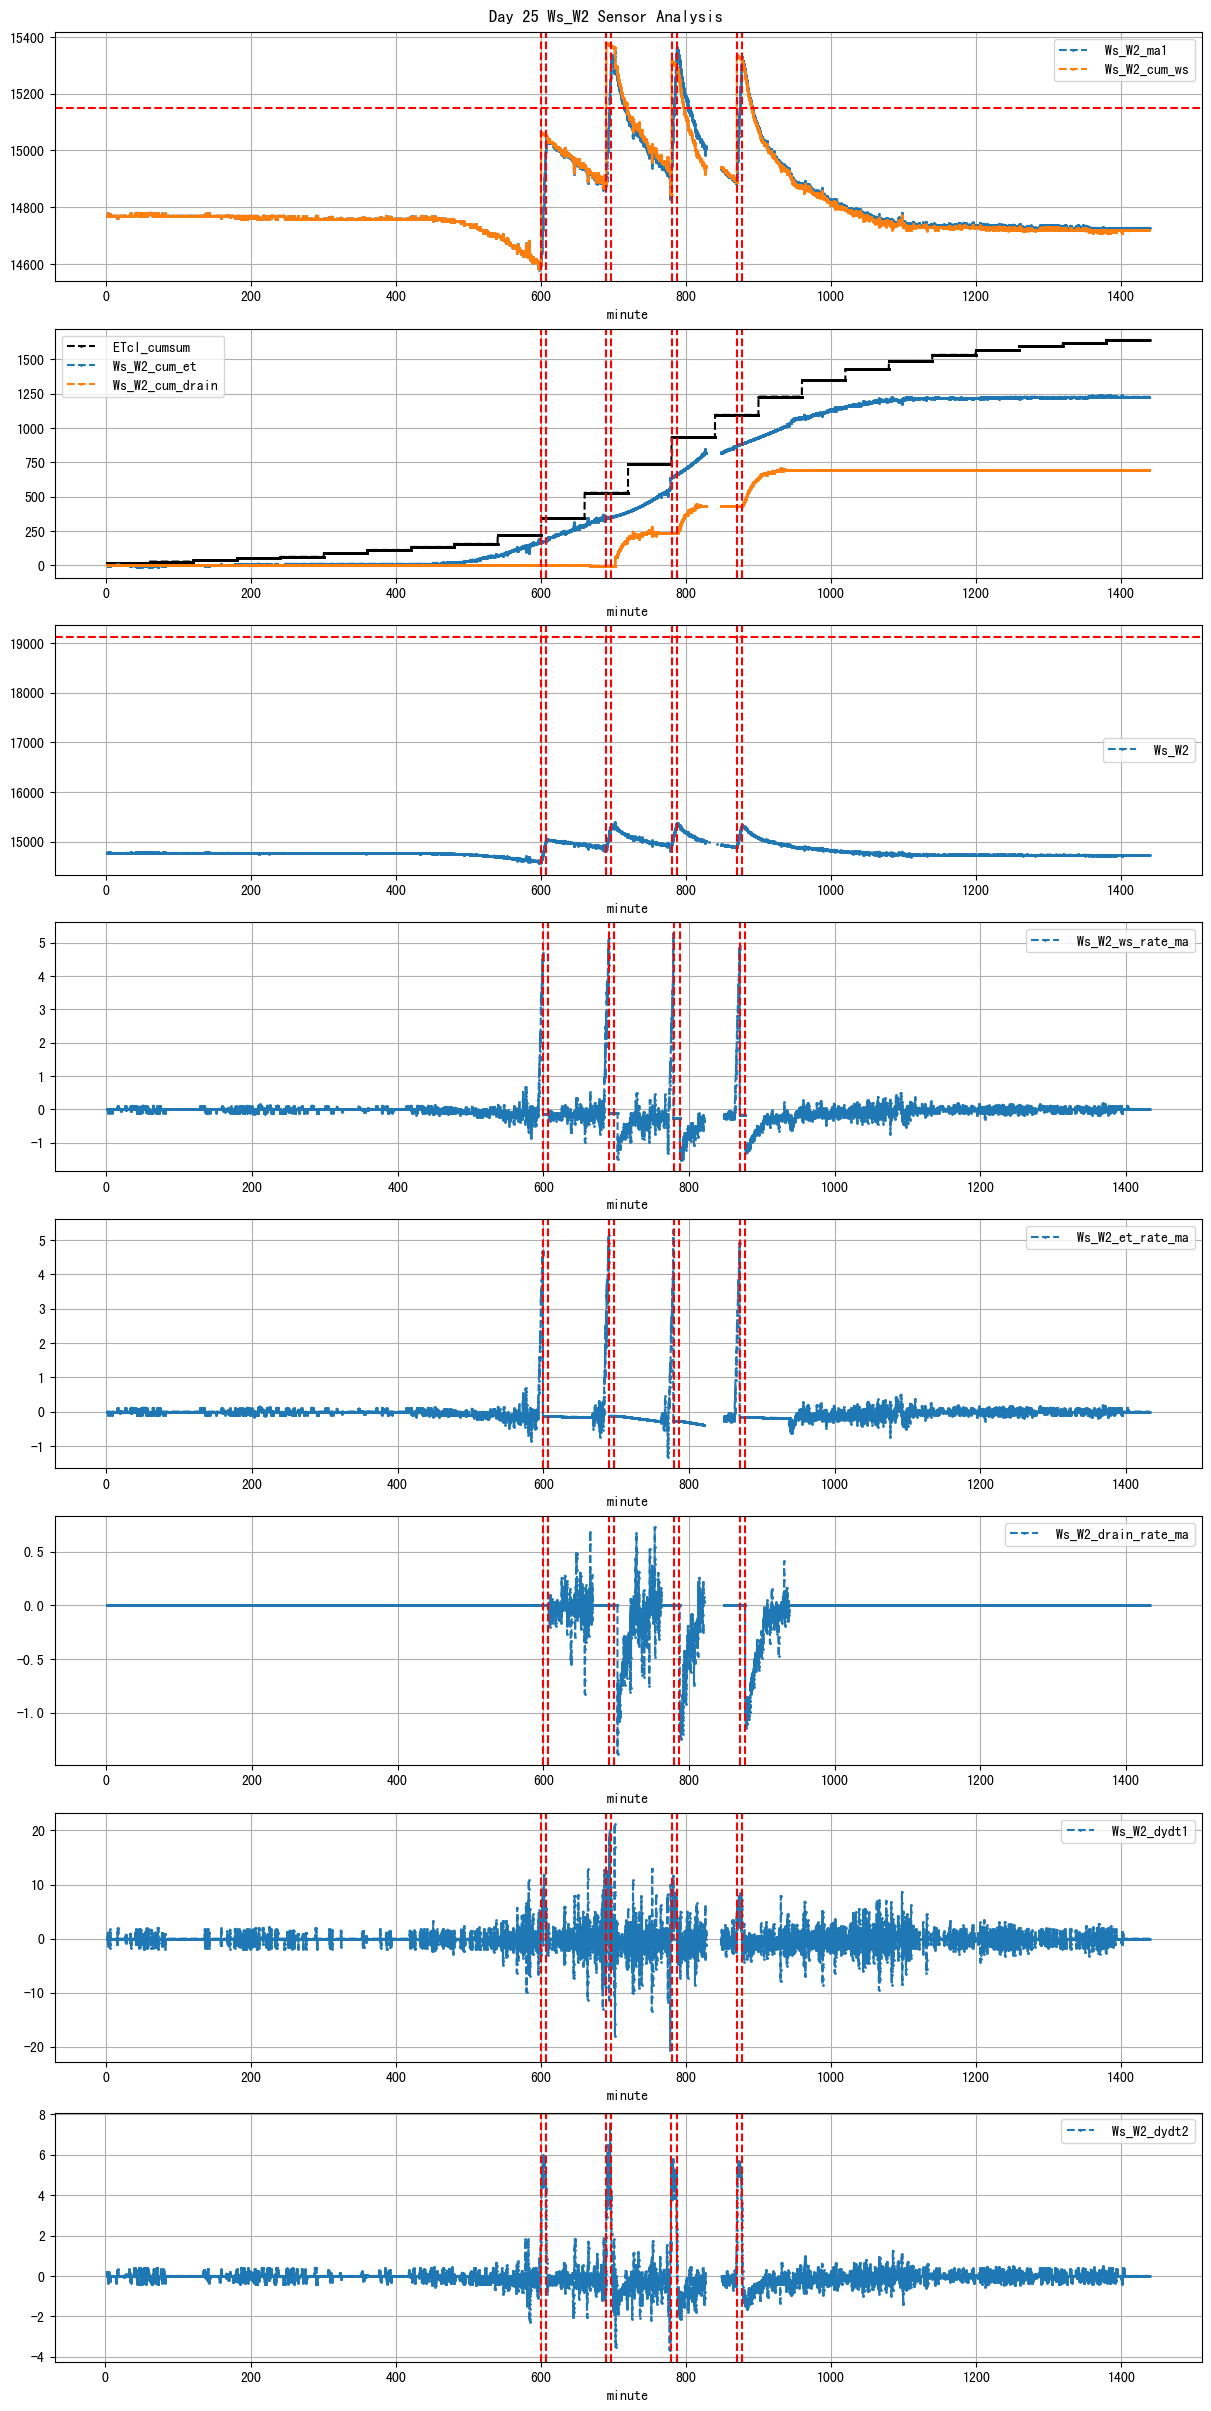
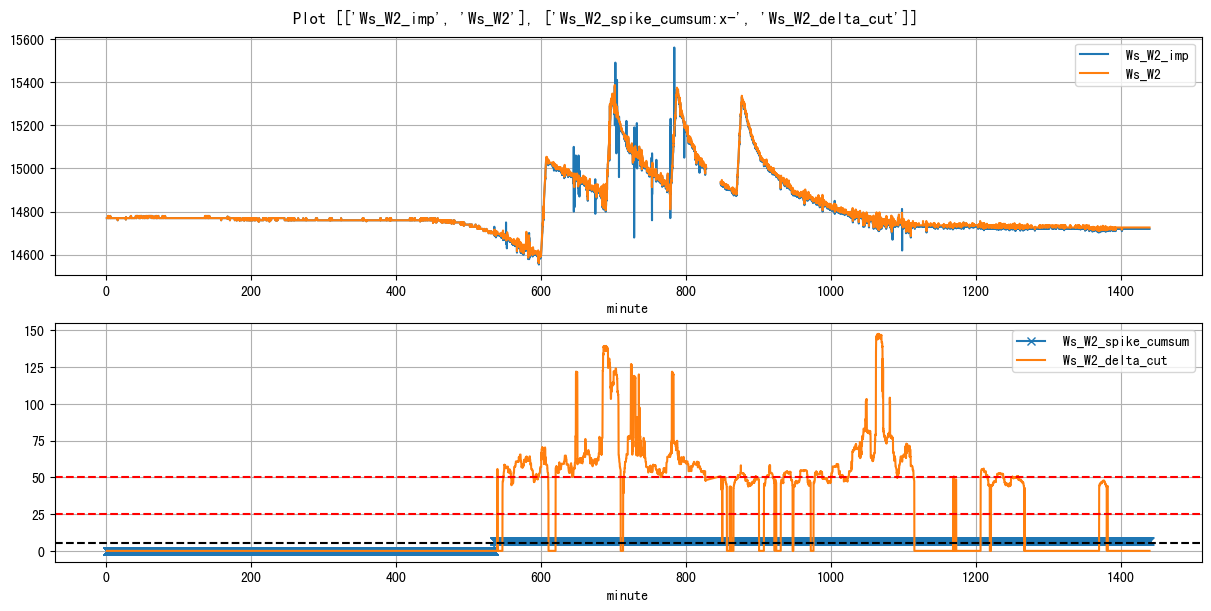
| ds | d | m | ws_name | prominence_cut | max_drain_du | fg_beg | fg_beg_est | fg_end | fg_end_est | ws_beg | ws_end | duc | pre_fg_et | post_fg_ws | post_drn_et | fg_rate_by_dydt | fg_rate_by_dWs | fg_stay_amount | enough_data | fg_beg_delta | fg_end_delta | fg_total_amount | fg_drain_amount | postFg_drain_amount | total_drain_amount | drain_du | drain_delay | drain_rate | field_capacity_est | FVI_W1 | FVO_W1 | FVI_W2 | FVO_W2 |
|---|---|---|---|---|---|---|---|---|---|---|---|---|---|---|---|---|---|---|---|---|---|---|---|---|---|---|---|---|---|---|---|---|---|
| 2026-03-26 10:00:00+08:00 | 25 | 600 | Ws_W2 | 1.564529 | 60 | 600.0 | 599.416667 | 607.00 | 607.500000 | 14596.666667 | 15047.848485 | 420 | -0.136303 | -0.190853 | -0.164345 | 1.090800 | 1.074242 | 451.181818 | True | -35.0 | 30.0 | 465.150000 | 0.0 | 0.000000 | 0.000000 | 100.0 | 1824.0 | -0.316383 | NaN | NaN | NaN | 502.0 | 4.0 |
| 2026-03-26 11:30:00+08:00 | 25 | 690 | Ws_W2 | 1.564529 | 60 | 690.0 | 690.166667 | 697.00 | 701.833333 | 14876.666667 | 15350.833333 | 420 | -0.121069 | -0.932433 | -0.285905 | 1.062000 | 1.128968 | 474.166667 | True | 10.0 | 290.0 | 474.166667 | 0.0 | 201.342697 | 201.342697 | 1085.0 | 294.0 | -0.842512 | 15149.490637 | NaN | NaN | 507.0 | 235.0 |
| 2026-03-26 13:00:00+08:00 | 25 | 780 | Ws_W2 | 1.564529 | 60 | 780.0 | 778.416667 | 787.02 | 787.416667 | 14912.266667 | 15363.516667 | 421 | -0.270029 | -1.203061 | -0.383837 | 1.032524 | 1.071853 | 451.250000 | True | -95.0 | 23.8 | 466.257500 | 15.0 | 198.642636 | 213.642636 | 1500.0 | 28.0 | -1.126590 | 15164.874031 | NaN | NaN | 512.0 | 297.0 |
| 2026-03-26 14:30:00+08:00 | 25 | 870 | Ws_W2 | 1.564529 | 60 | 870.0 | 869.500000 | 877.00 | 877.083333 | 14896.666667 | 15330.666667 | 420 | -0.160320 | -1.144503 | -0.194444 | 1.052133 | 1.033333 | 434.000000 | True | -30.0 | 5.0 | 465.150000 | 31.1 | 238.926478 | 270.026478 | 1804.0 | 35.0 | -1.015832 | 15091.740189 | NaN | NaN | 510.0 | 295.0 |