| 2026-01-13 10:05:00+08:00 |
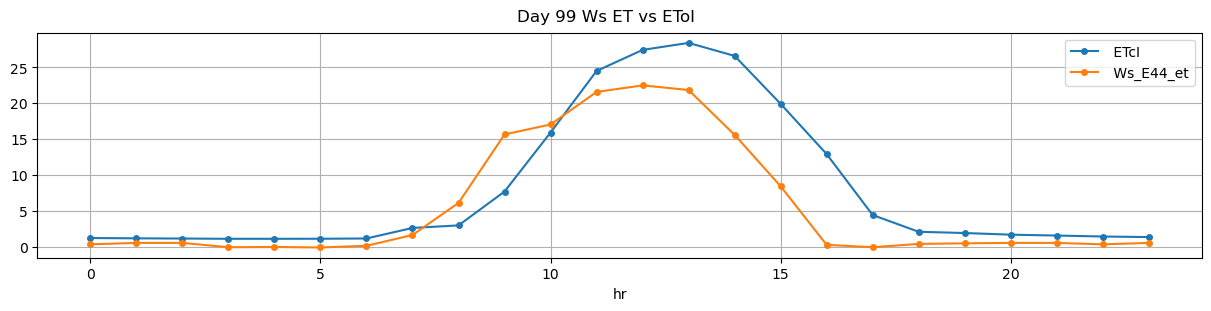
99 |
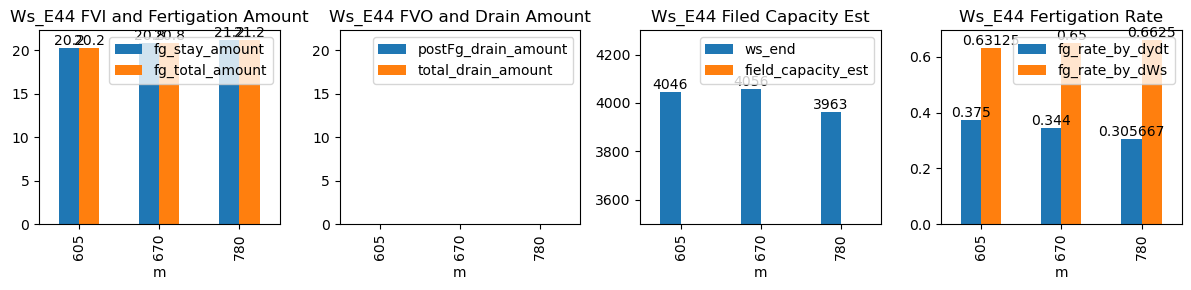
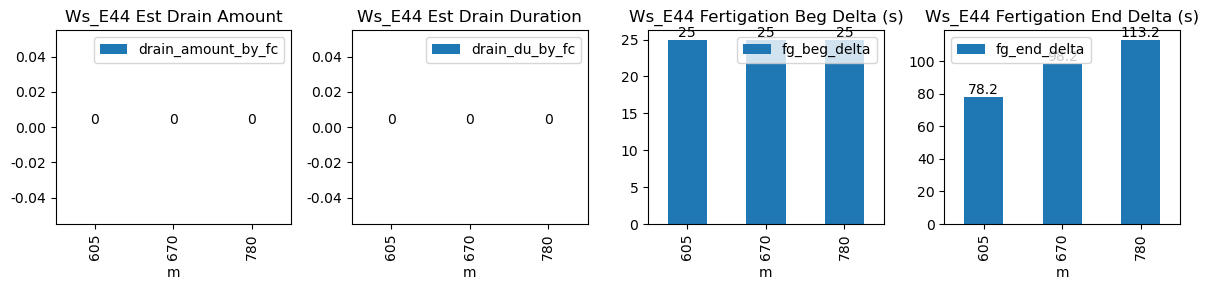
605 |
Ws_E44 |
0.359278 |
30 |
605.0 |
605.416667 |
605.53 |
606.833333 |
NaN |
NaN |
NaN |
3945.0 |
4046.0 |
32 |
-0.150477 |
-0.098333 |
-0.126001 |
0.375000 |
0.63125 |
20.2 |
25.0 |
78.2 |
20.2 |
0.0 |
-1.612330 |
NaN |
-1.612330 |
| 2026-01-13 11:10:00+08:00 |
99 |
670 |
Ws_E44 |
0.359278 |
30 |
670.0 |
670.416667 |
670.53 |
672.166667 |
NaN |
NaN |
NaN |
3952.0 |
4056.0 |
32 |
-0.149812 |
-0.184722 |
-0.145509 |
0.344000 |
0.65000 |
20.8 |
25.0 |
98.2 |
20.8 |
0.0 |
-0.312075 |
NaN |
-0.312075 |
| 2026-01-13 13:00:00+08:00 |
99 |
780 |
Ws_E44 |
0.359278 |
30 |
780.0 |
780.416667 |
780.53 |
782.416667 |
NaN |
NaN |
NaN |
3857.0 |
3963.0 |
32 |
-0.151110 |
-0.182407 |
-0.156852 |
0.305667 |
0.66250 |
21.2 |
25.0 |
113.2 |
21.2 |
0.0 |
-1.314686 |
NaN |
-1.314686 |