| 2026-01-17 09:05:00+08:00 |
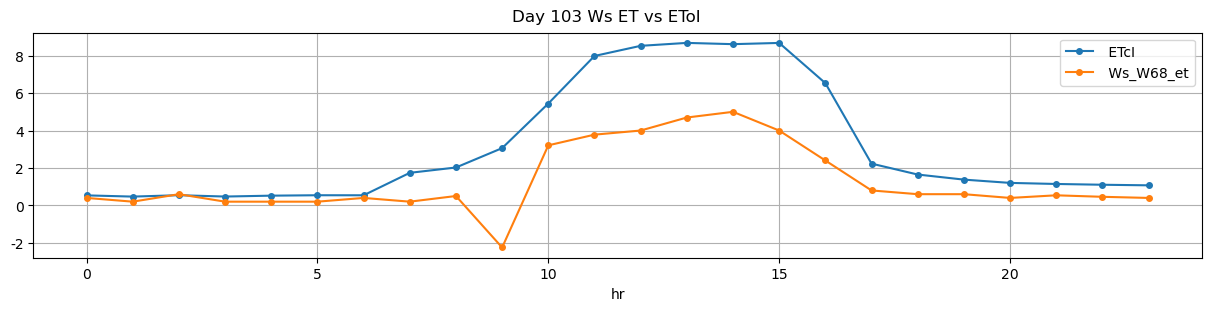
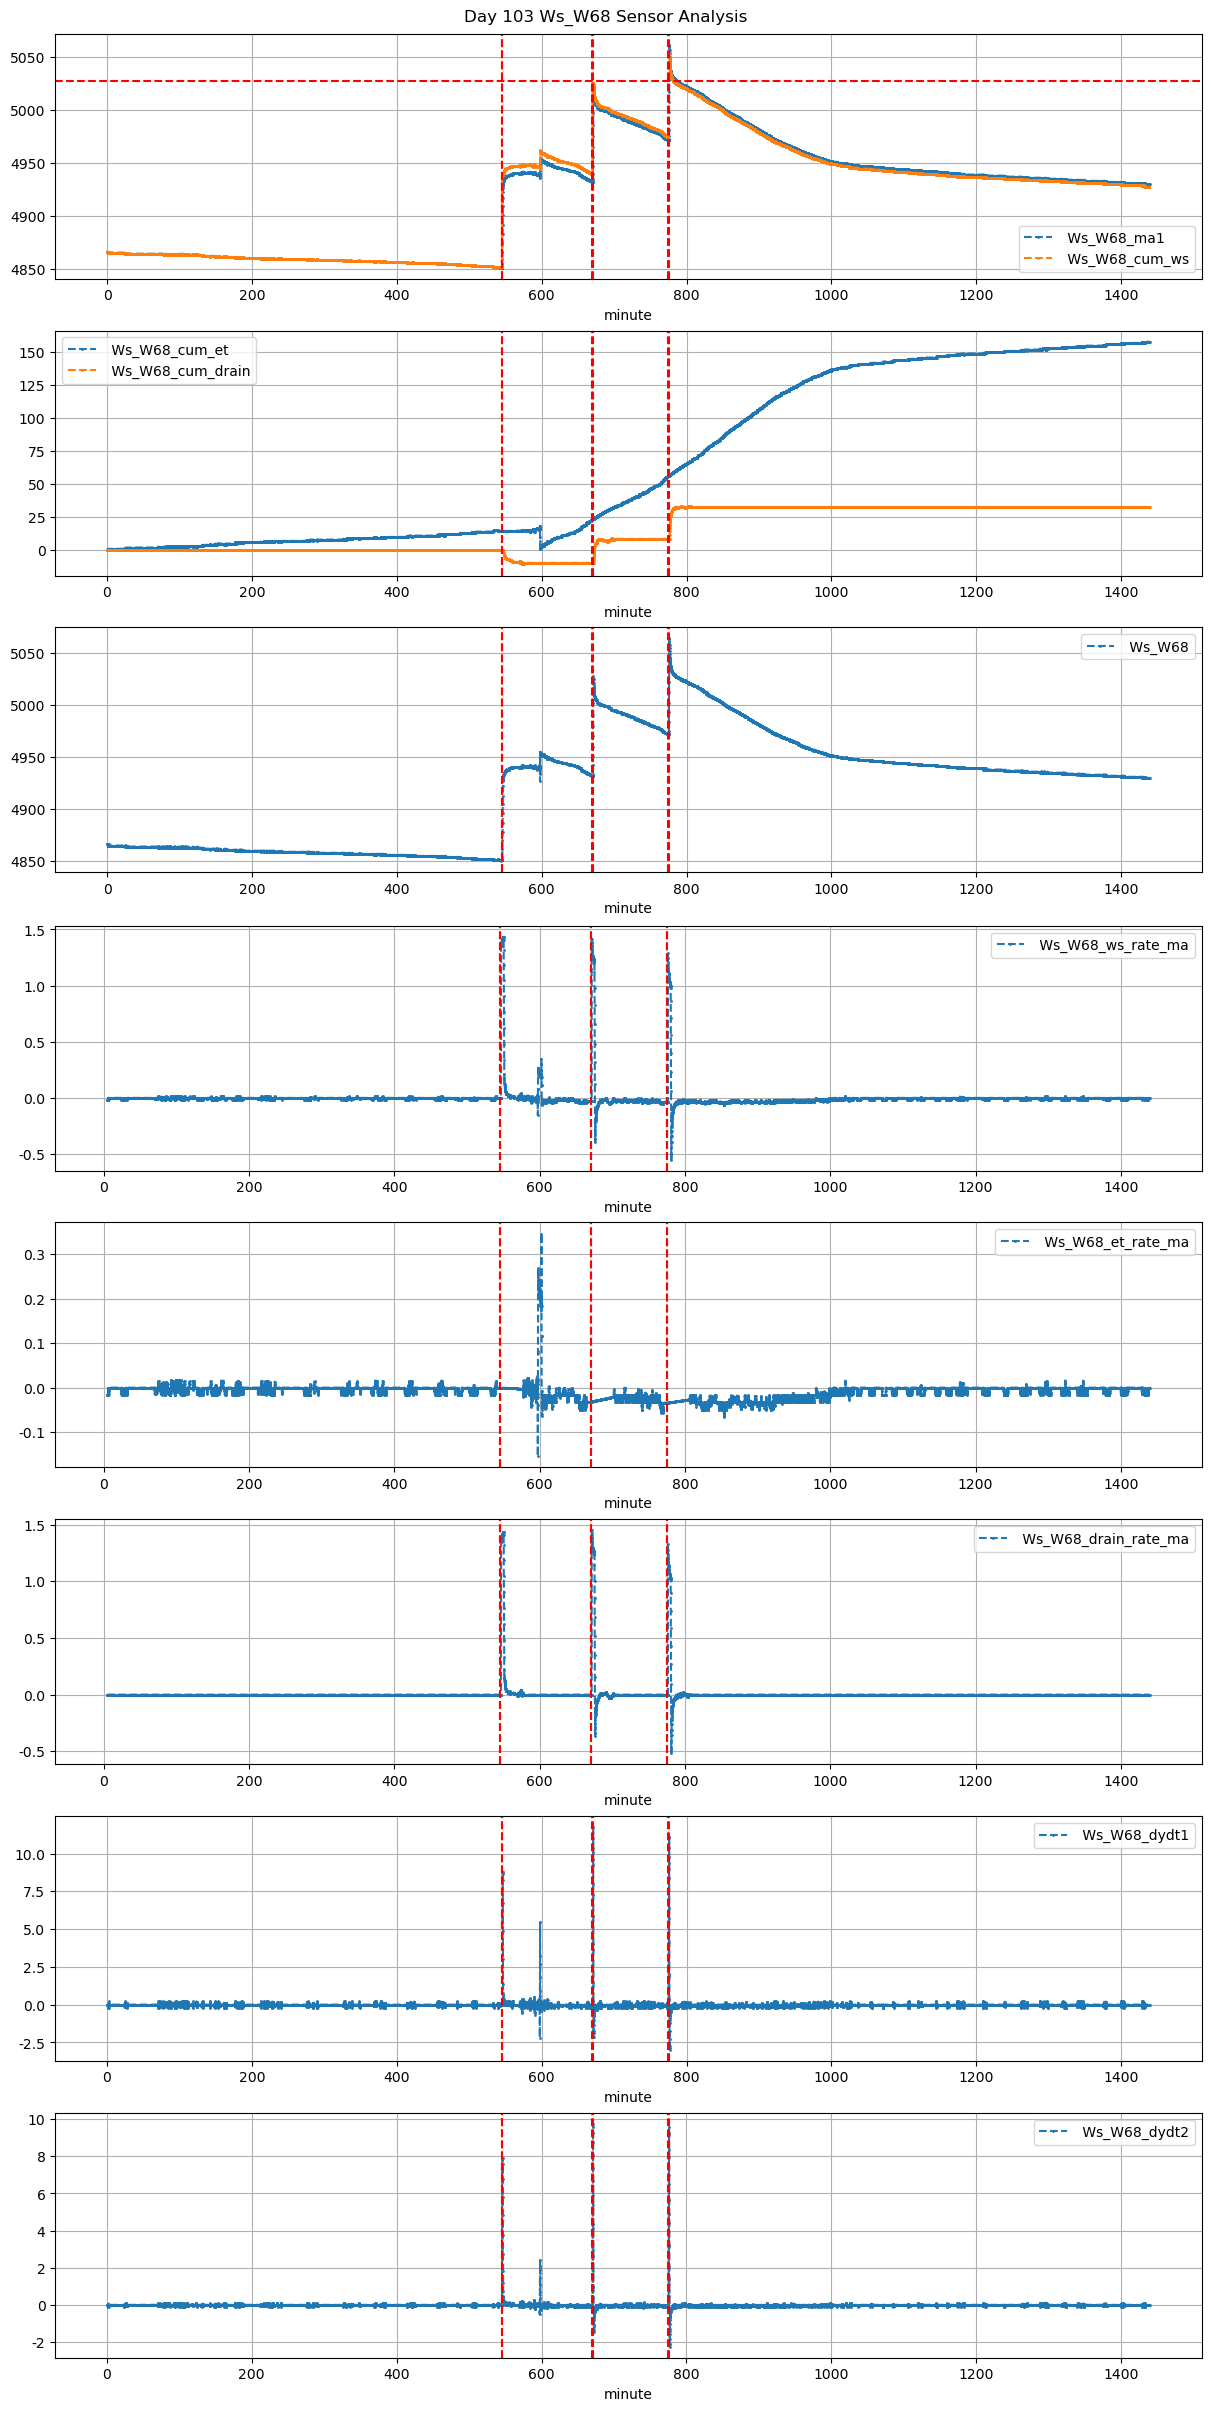
103 |
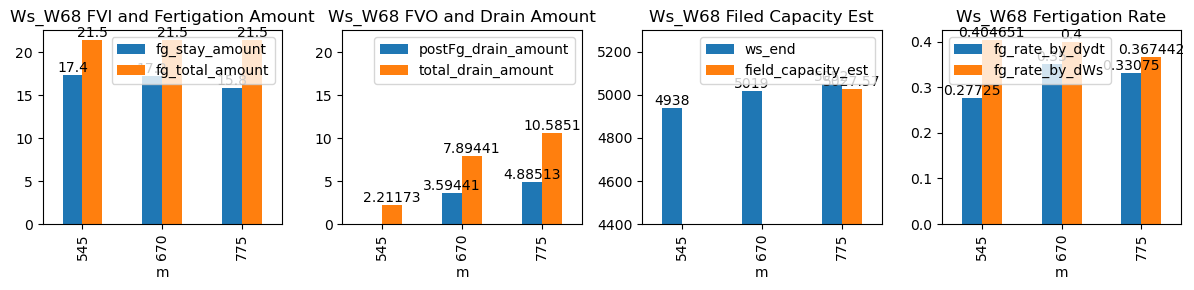
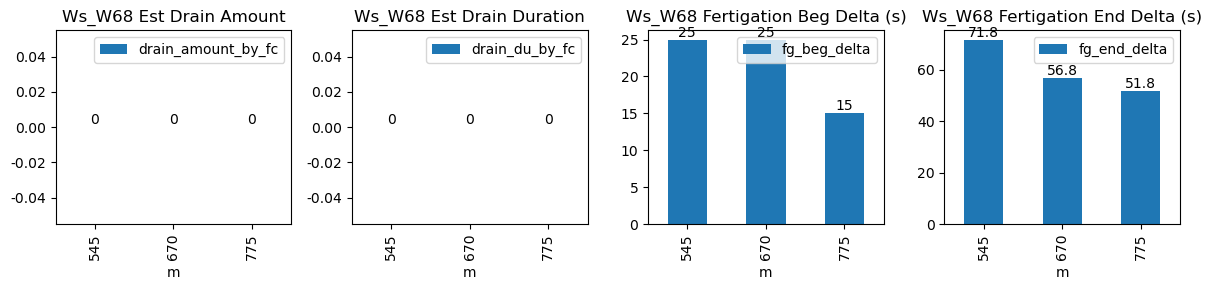
545 |
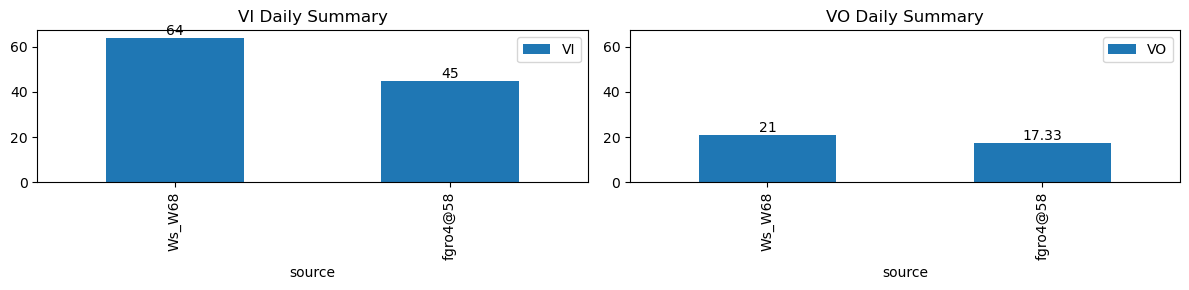
Ws_W68 |
0.295869 |
30 |
545.0 |
545.416667 |
545.72 |
546.916667 |
NaN |
NaN |
NaN |
4851.0 |
4938.0 |
43 |
-0.001836 |
0.000000 |
-0.002639 |
0.27725 |
0.404651 |
17.4 |
25.0 |
71.8 |
21.5 |
4.1 |
-1.888272 |
NaN |
2.211728 |
| 2026-01-17 11:10:00+08:00 |
103 |
670 |
Ws_W68 |
0.295869 |
30 |
670.0 |
670.416667 |
670.72 |
671.666667 |
NaN |
NaN |
NaN |
4933.0 |
5019.0 |
43 |
-0.031215 |
-0.100417 |
-0.020694 |
0.35000 |
0.400000 |
17.2 |
25.0 |
56.8 |
21.5 |
4.3 |
3.594409 |
NaN |
7.894409 |
| 2026-01-17 12:55:00+08:00 |
103 |
775 |
Ws_W68 |
0.295869 |
30 |
775.0 |
775.250000 |
775.72 |
776.583333 |
NaN |
NaN |
NaN |
4973.0 |
5052.0 |
43 |
-0.033616 |
-0.116389 |
-0.026458 |
0.33075 |
0.367442 |
15.8 |
15.0 |
51.8 |
21.5 |
5.7 |
4.885134 |
5027.57433 |
10.585134 |