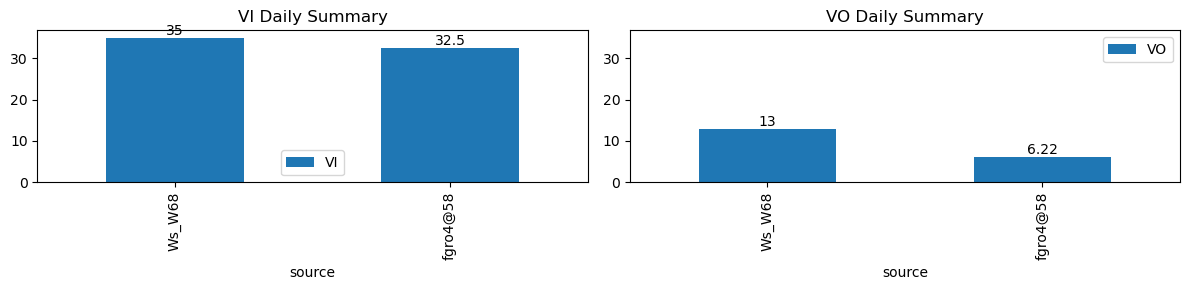
VI and VO Daily Summary
| ws_name | total_dp | nan_dp | nan_filled_dp | long_gap_dp | num_spike |
|---|---|---|---|---|---|
| Ws_W68 | 17269 | 0 | 14551 | 0 | 0 |
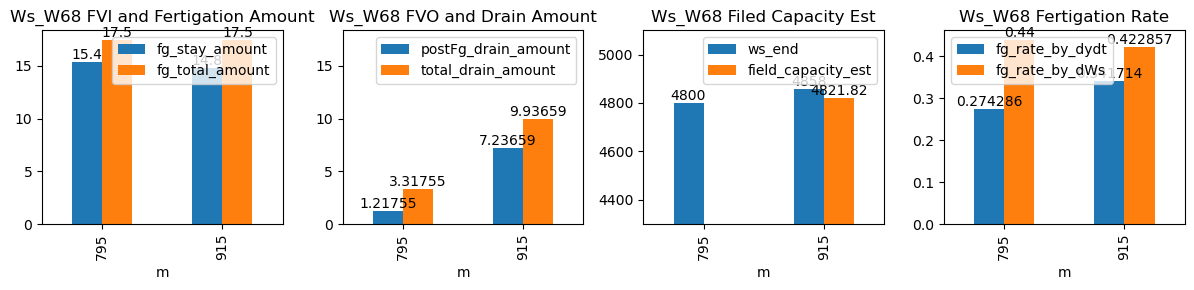
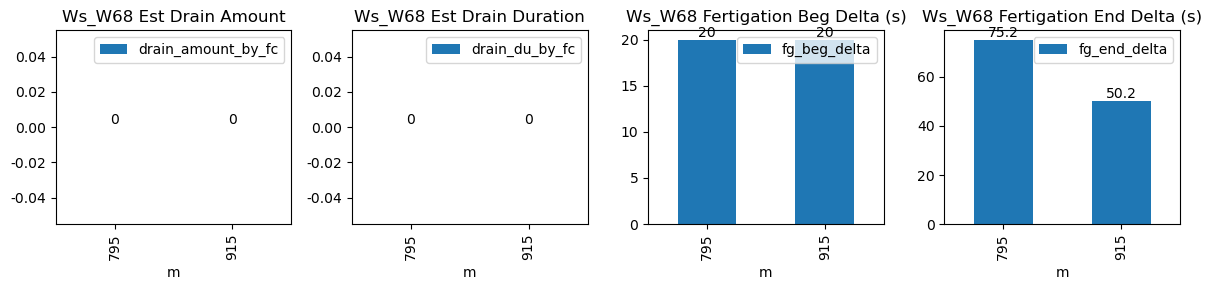
| ds | d | m | ws_name | prominence_cut | max_drain_du | fg_beg | fg_beg_est | fg_end | fg_end_est | drain_amount_by_fc | drain_du_by_fc | drain_rate_by_fc | ws_beg | ws_end | duc | pre_fg_et | post_fg_ws | post_drn_et | fg_rate_by_dydt | fg_rate_by_dWs | fg_stay_amount | fg_beg_delta | fg_end_delta | fg_total_amount | fg_drain_amount | postFg_drain_amount | field_capacity_est | total_drain_amount |
|---|---|---|---|---|---|---|---|---|---|---|---|---|---|---|---|---|---|---|---|---|---|---|---|---|---|---|---|---|
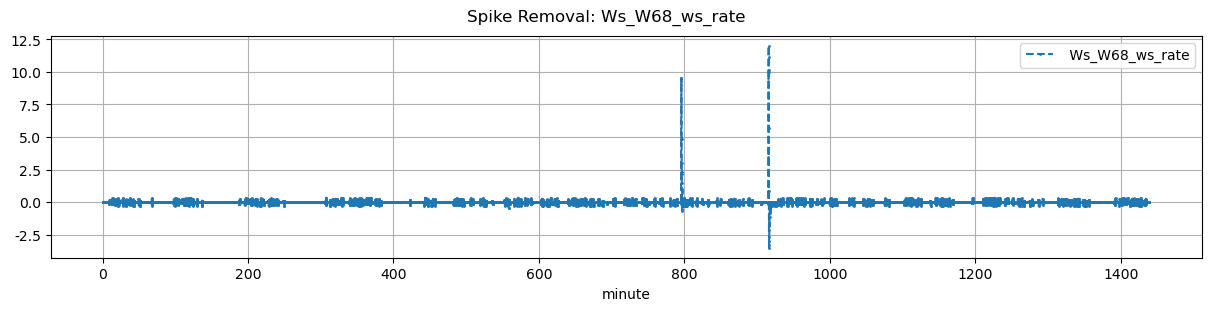
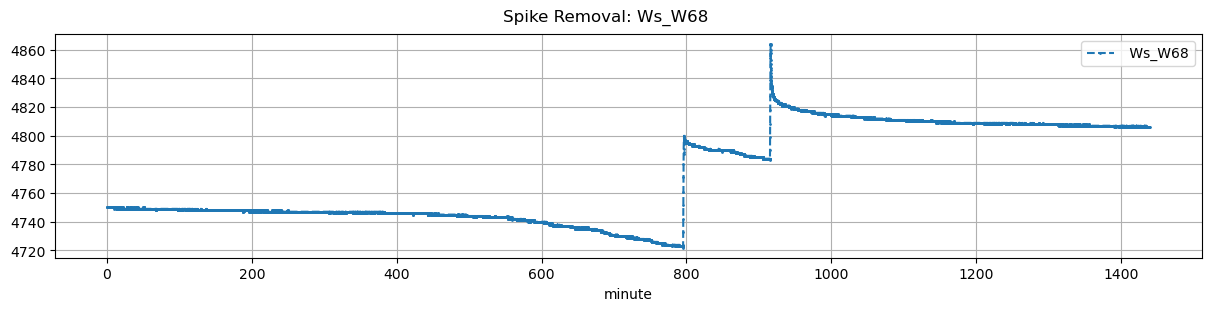
| 2025-12-24 13:15:00+08:00 | 79 | 795 | Ws_W68 | 0.30351 | 30 | 795.0 | 795.333333 | 795.58 | 796.833333 | NaN | NaN | NaN | 4723.0 | 4800.0 | 35 | -0.003013 | -0.028889 | -0.011250 | 0.274286 | 0.440000 | 15.4 | 20.0 | 75.2 | 17.5 | 2.1 | 1.217546 | NaN | 3.317546 |
| 2025-12-24 15:15:00+08:00 | 79 | 915 | Ws_W68 | 0.30351 | 30 | 915.0 | 915.333333 | 915.58 | 916.416667 | NaN | NaN | NaN | 4784.0 | 4858.0 | 35 | -0.002542 | -0.131250 | -0.012516 | 0.341714 | 0.422857 | 14.8 | 20.0 | 50.2 | 17.5 | 2.7 | 7.236588 | 4821.817059 | 9.936588 |